Lili Park
Vice President, Client Service
Get to Know Lili
This week’s Chart of the Week chronicles Japan’s trade deficit over the last five years. In the graph, the red line represents Japan’s month-end trade balance, while the charcoal line is the 100-day moving average of the trade balance. Most important in the chart is that Japan logged its first annual trade deficit in more than 30 years for 2011, as measured by the aggregation of month end trade deficits (note that although month-end trade deficits were larger in late 2008 and early 2009, the total trade balance for each of those years was actually positive). The 2011 trade deficit of 2.49 trillion yen (approximately $32 billion) is due at least in part to the March earthquake and tsunami, which paralyzed production/exports and provoked a surge of costly fuel imports to cover for the loss of nuclear power. Shortly after the March 2011 earthquake devastation, Japanese exports – the leading engine of Japan’s economic growth the last six years – declined 12.0% in April, and continued to decline in May. Furthermore, a persistently strong yen contributed to the reduction of total exports by 2.7% since last year while imports surged by 12%.
In terms of market impact, the emergence of a trade deficit in Japan leaves to question how much longer the country can fund its gross national debt, currently just under 230% of GDP, without reliance on foreign investors. If exports continue to fall and imports rise, the need for foreign investment will increase. However, foreign investors are unlikely to accept the low yields of the past, so a rise in rates for Japanese debt would seem probable.

The opinions expressed herein are those of Marquette Associates, Inc. (“Marquette”), and are subject to change without notice. This material is not financial advice or an offer to purchase or sell any product. Marquette reserves the right to modify its current investment strategies and techniques based on changing market dynamics or client needs.
10.27.2025
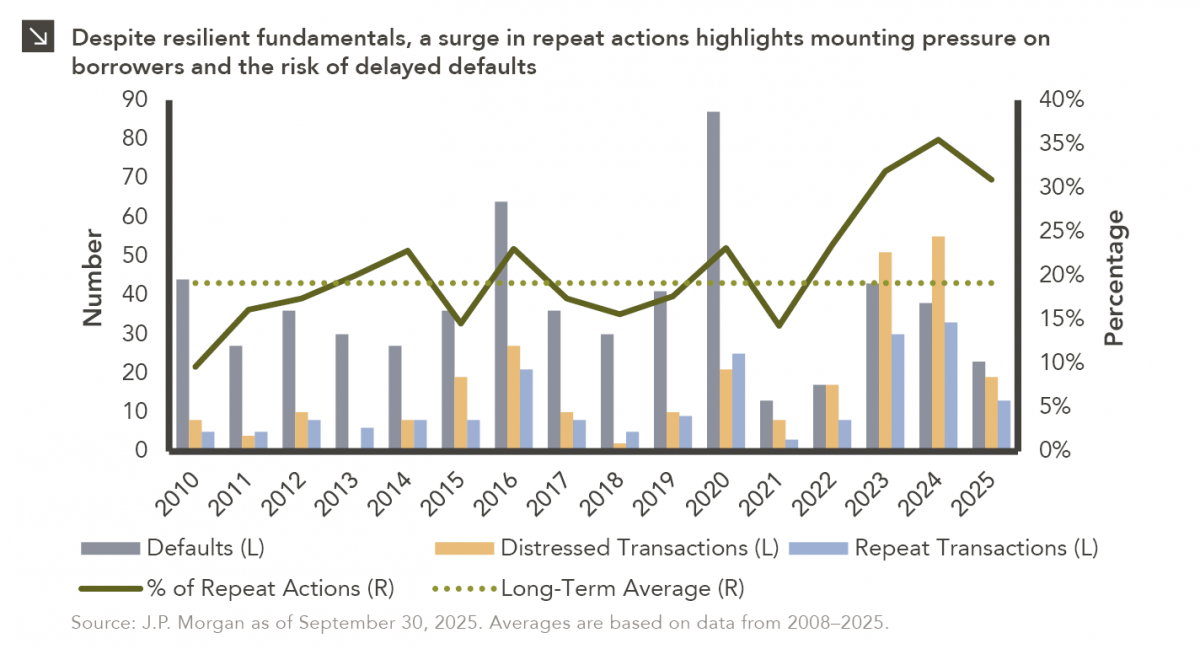
To paraphrase a quote from former President George W. Bush: “Fool me once, shame on… shame on you. Fool me…
10.20.2025
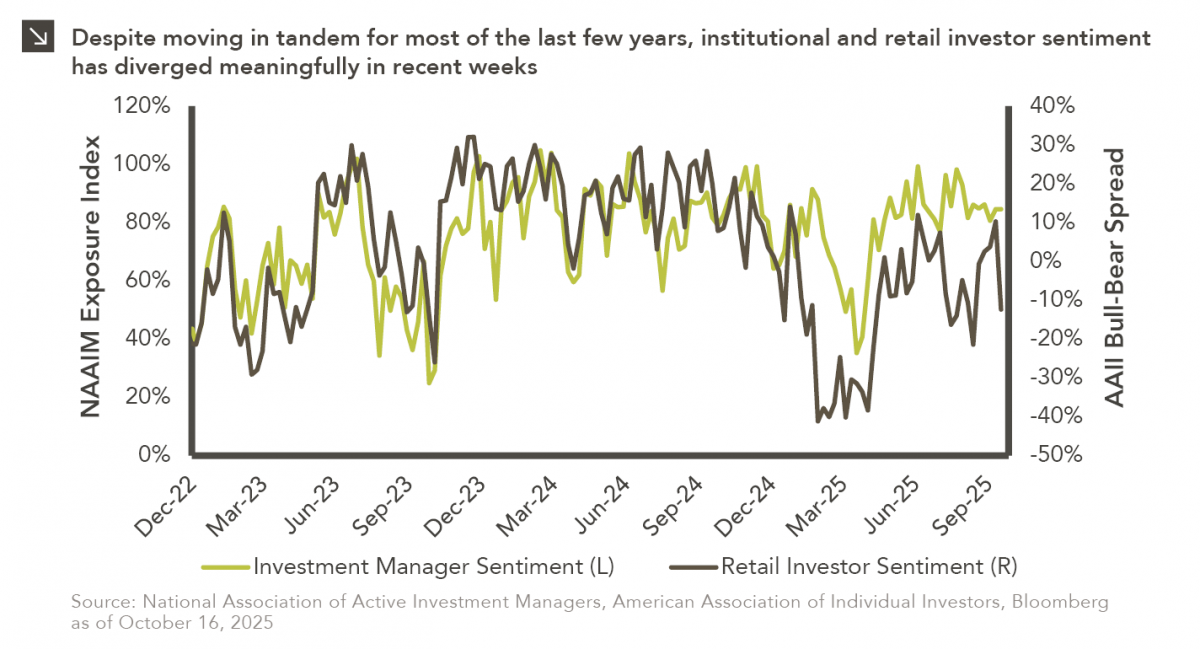
This week’s chart compares institutional and retail investor sentiment using two established indicators. Institutional sentiment is represented by the National…
10.13.2025
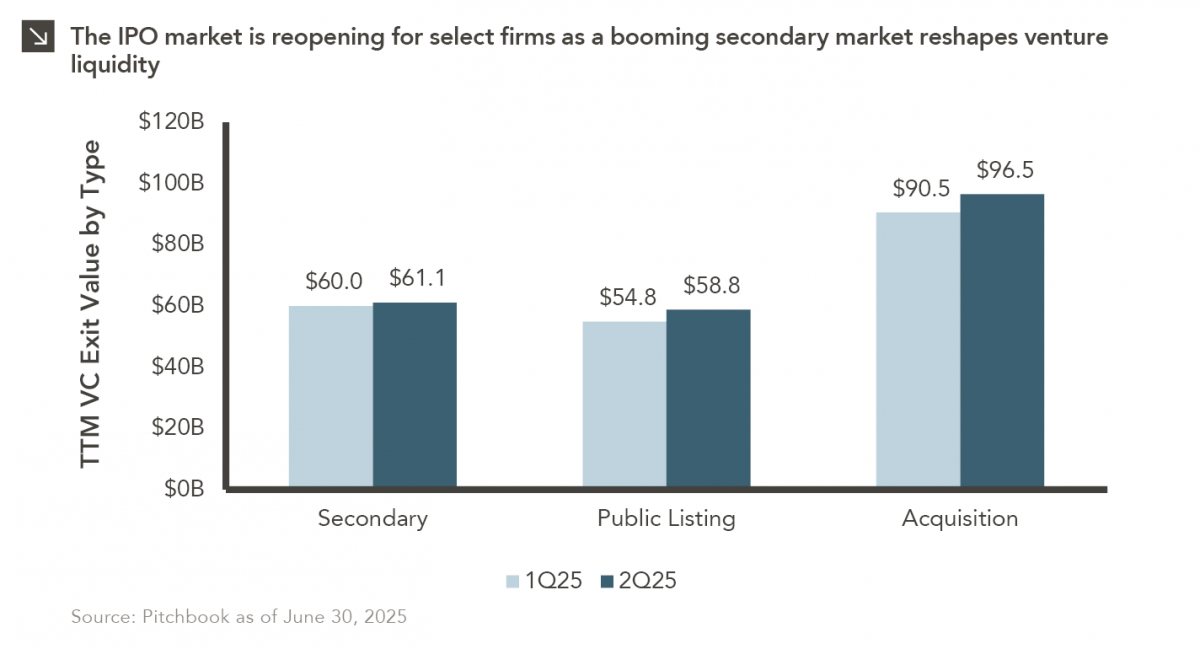
After a three-year drought, the IPO market is stirring again… but only for a select few. Just 18 companies have…
10.06.2025
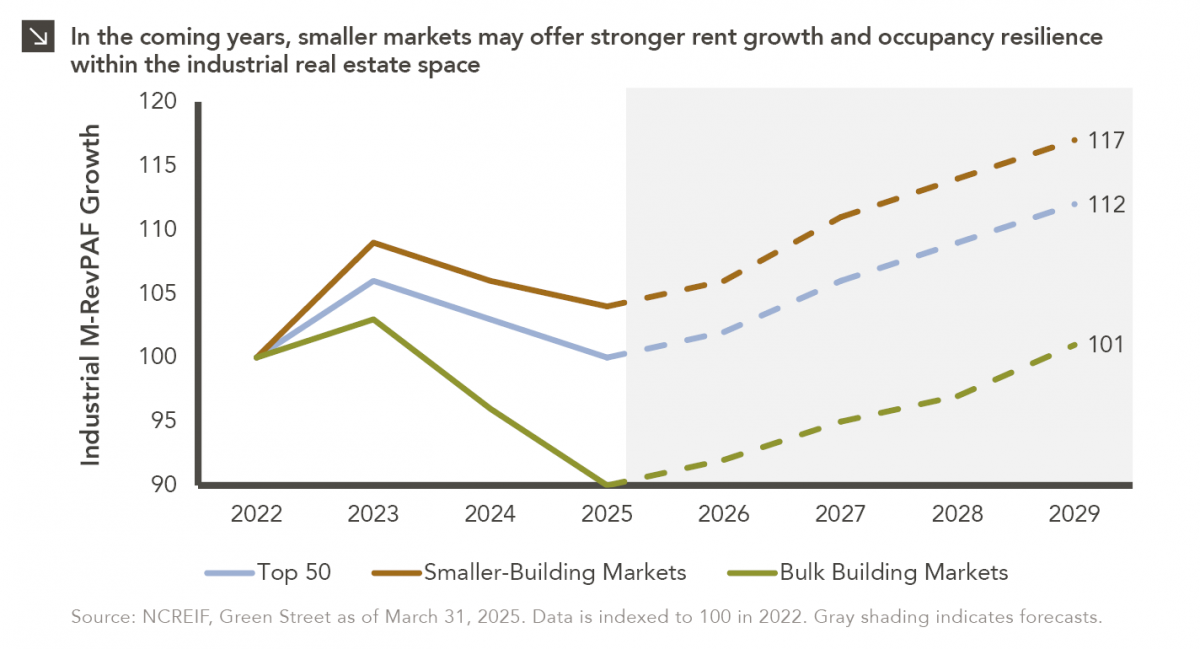
This week’s chart compares realized and expected Market Revenue per Available Foot (“M-RevPAF”) growth within the industrial real estate space…

09.29.2025
Trifecta status for a state exists when a single political party holds the governor’s seat and a majority in both…

09.22.2025
Barring a significant equity market drawdown in the coming weeks, the current bull market will turn three years old in…
Research alerts keep you updated on our latest research publications. Simply enter your contact information, choose the research alerts you would like to receive and click Subscribe. Alerts will be sent as research is published.
We respect your privacy. We will never share or sell your information.
If you have questions or need further information, please contact us directly and we will respond to your inquiry within 24 hours.
Contact Us >