Christopher Caparelli, CFA
Partner
Under the Fed’s zero interest rate policy, high yield bonds have enjoyed a terrific run of performance. For the five-year period ending June 30, 2014, the Barclays U.S. Corporate High Yield index produced an impressive annualized return of 14.0% per year. However, returns in this more speculative portion of the bond market have been disappointing since last summer, when the high yield spread over Treasuries reached a multi-decade low of 221 basis points. The index fell 0.4% in the twelve months ending June 30, 2015, and has continued to show weakness, falling another 1.9% through the middle of August.
This week’s chart examines the past relationship between high yield spreads and rate tightening cycles.1 Although there certainly isn’t a perfect correlation, tightening activity by the Fed has often caused high yield spreads to widen, significantly impacting total return potential. It is no secret that low and stable interest rates are good for speculative companies that are active in the debt markets. While a rake hike doesn’t spell impending doom for the entire high yield universe, some of the more speculative borrowers who have become accustomed to borrowing at ultra-low rates could be in trouble, particularly if the Fed embarks on a prolonged period of successive rate hikes. As we prepare for the first Fed rate hike — likely later this fall — it will be important to pay close attention to high yield exposure within investment portfolios as well as manager positioning within the high yield space.
1 Most recent rate tightening lines refer to the end of QE 1 and 2 and the start of the Fed’s tapering

The opinions expressed herein are those of Marquette Associates, Inc. (“Marquette”), and are subject to change without notice. This material is not financial advice or an offer to purchase or sell any product. Marquette reserves the right to modify its current investment strategies and techniques based on changing market dynamics or client needs.
04.01.2026
Fixed income is the largest global financial market and often one of the largest allocations within institutional investors’ portfolios. A…
03.30.2026
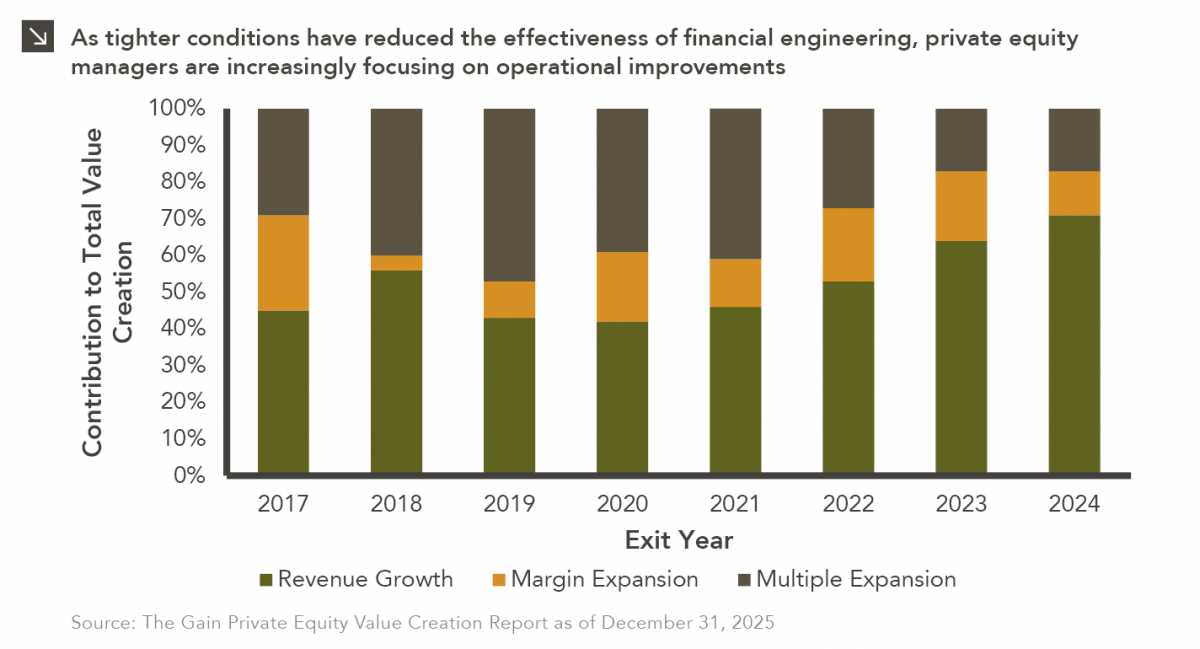
In the period between 2009 and 2022, private equity managers thrived amid an environment of low interest rates and rising…

03.23.2026
Global energy costs have risen sharply this month due to a convergence of geopolitical shocks, as critical infrastructure and transport…

03.16.2026
This week’s chart illustrates a clear structural shift in the fundraising dynamics of North American closed-end real estate funds over…

03.09.2026
Warren Buffett once implored investors to “be greedy when others are fearful,” and this sage advice is certainly applicable to…

03.02.2026
Recent market dynamics in the software sector reflect a sharp shift in investor sentiment driven primarily by concerns that advances…
Research alerts keep you updated on our latest research publications. Simply enter your contact information, choose the research alerts you would like to receive and click Subscribe. Alerts will be sent as research is published.
We respect your privacy. We will never share or sell your information.
If you have questions or need further information, please contact us directly and we will respond to your inquiry within 24 hours.
Contact Us >