Christopher Caparelli, CFA
Partner
As U.S. equity indices again touched record highs during the first quarter, the appropriate valuation level for the market continues to be a popular topic in the financial press. Complicating the issue for investors is the tendency of the financial press to use different valuation methods interchangeably (trailing price to earnings, forward price to earnings, cyclically adjusted price to earnings, enterprise value to pre-tax income, etc.). Oftentimes different valuation methods will flash different signals and there is no single method generally accepted as the “correct” indicator. When confusion arises, it is natural to have Warren Buffett weigh in on the issue with his trademark simplicity. In a 2001 article appearing in Fortune Magazine, Mr. Buffett commented that at any given point in the market cycle, market-cap to GDP is likely the best long-term valuation indicator of the market.
In this week’s chart, we plot the market-cap to GDP ratio for the U.S. by dividing the average quarterly market-cap of the Wilshire 5000 index by the quarterly nominal GDP of the U.S. economy. At the end of 2014, this ratio stood at 122%, the highest level seen since the late 1990s and almost 2 standard deviations away from the 43-year average. Although revered by Mr. Buffett, this indicator should not be relied upon for its predictive power. Instead, it should serve as another data point that urges caution to investors considering outsized allocations to U.S. equity.

The opinions expressed herein are those of Marquette Associates, Inc. (“Marquette”), and are subject to change without notice. This material is not financial advice or an offer to purchase or sell any product. Marquette reserves the right to modify its current investment strategies and techniques based on changing market dynamics or client needs.
11.10.2025
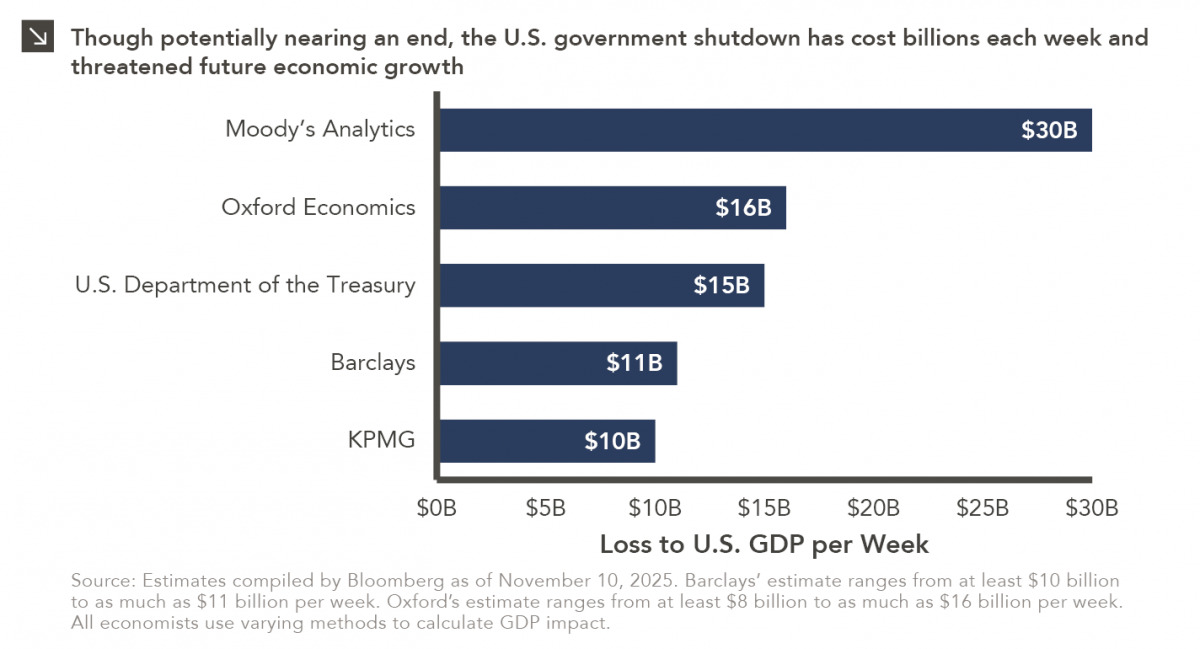
Over the weekend, the Senate overcame a key procedural obstacle in its attempt to end the record-breaking government shutdown, as…
11.03.2025
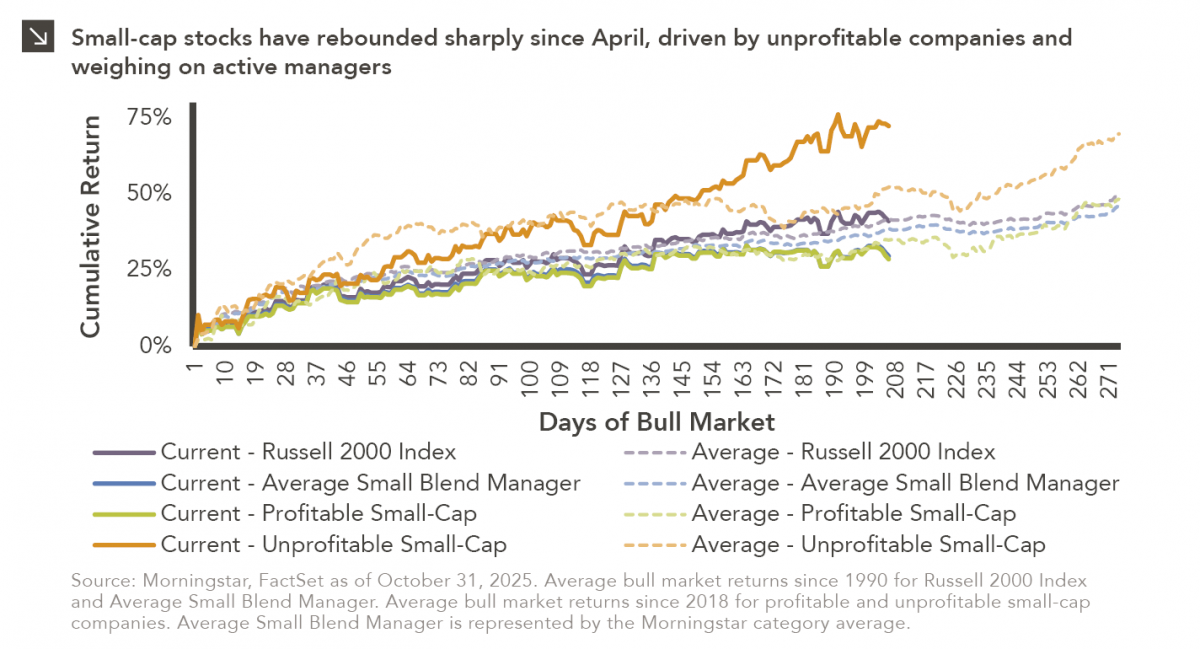
Small-cap equities are in a prolonged period of underperformance relative to large-cap stocks, but this trend has shown early signs…
10.27.2025
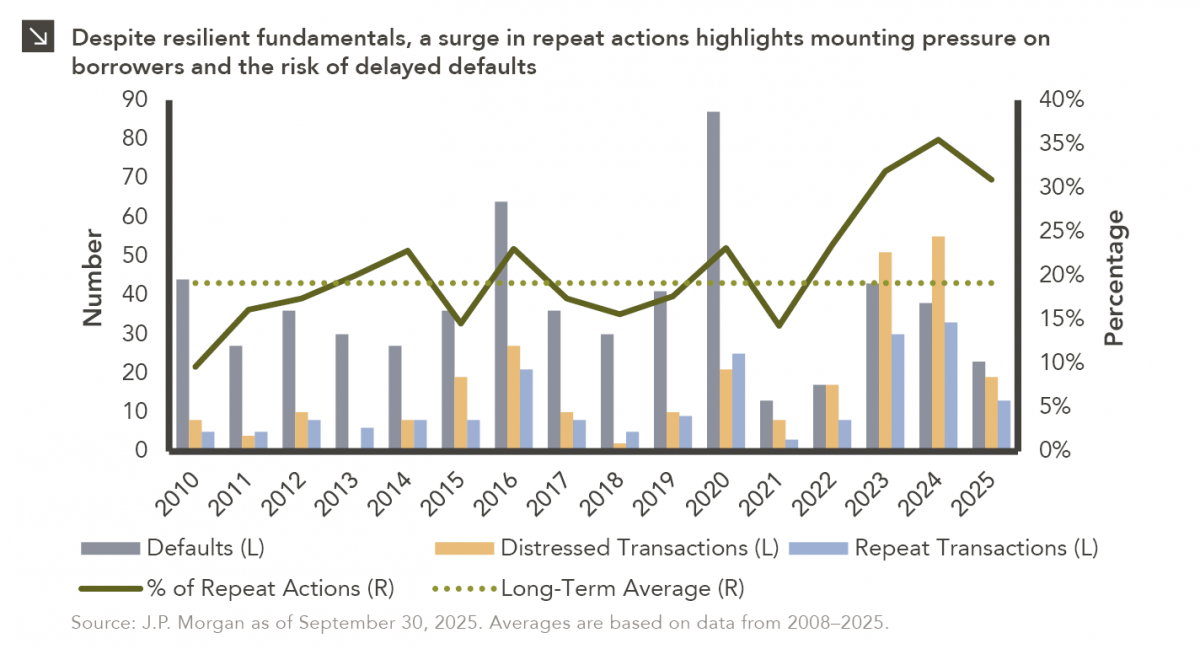
To paraphrase a quote from former President George W. Bush: “Fool me once, shame on… shame on you. Fool me…

10.22.2025
This video is a recording of a live webinar held October 22 by Marquette’s research team analyzing the third quarter…
10.22.2025
I spent the past weekend at my alma mater to watch them play their biggest rival. Football weekends there are…
10.20.2025
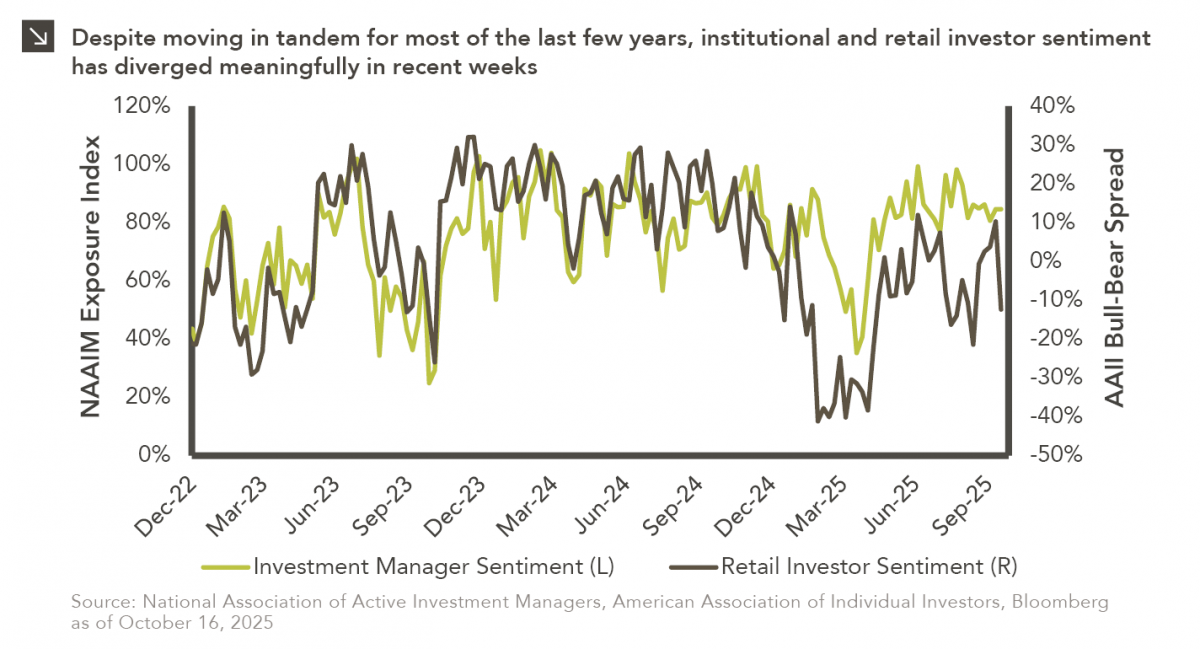
This week’s chart compares institutional and retail investor sentiment using two established indicators. Institutional sentiment is represented by the National…
Research alerts keep you updated on our latest research publications. Simply enter your contact information, choose the research alerts you would like to receive and click Subscribe. Alerts will be sent as research is published.
We respect your privacy. We will never share or sell your information.
If you have questions or need further information, please contact us directly and we will respond to your inquiry within 24 hours.
Contact Us >