Christopher Caparelli, CFA
Partner
Among the many factors the Congressional Budget Office (“CBO”) must estimate in budget projections provided to Congress, GDP is often the most important, as it provides a foundation for most other forecasts. While near term GDP growth can often be estimated with some accuracy based on current trends, longer term forecasts rely upon potential GDP. Utilizing the economic factors of labor input and physical capital, potential GDP is a measure of the maximum sustainable output of the national economy. It is the level that national output should be when the economy is at full employment and full resource utilization.
Going back to the 1950’s, real GDP has often plotted very near the CBO’s potential GDP forecast, often correcting any deviation quickly. Since the sharp economic downturn experienced in 2008, however, real GDP has remained below potential GDP, creating a sizeable output gap. In order to close that output gap, the national economy must grow at a faster rate than it has since 2008.
The various dotted lines on the graph contemplate constant forward growth rates in real GDP from the last recorded observation in the third quarter of 2012. Although it is unrealistic to assume the national economy will grow at a constant rate going forward, the analysis presents a hypothetical best/worst case scenario. If the national economy were to grow at a constant 5% annualized growth rate beginning in the fourth quarter of 2012, it would take the national economy until the third quarter of 2014 to realize its potential output. A 4% growth rate would reach potential GDP in the second quarter of 2015, and a 3% constant growth rate would reach potential GDP in the third quarter of 2020. If the national economy were to grow at a constant 2% rate – not far from the observed growth rates of the previous handful of quarters – the gap between real and potential output will continue to grow.

The opinions expressed herein are those of Marquette Associates, Inc. (“Marquette”), and are subject to change without notice. This material is not financial advice or an offer to purchase or sell any product. Marquette reserves the right to modify its current investment strategies and techniques based on changing market dynamics or client needs.

03.23.2026
Global energy costs have risen sharply this month due to a convergence of geopolitical shocks, as critical infrastructure and transport…

03.16.2026
This week’s chart illustrates a clear structural shift in the fundraising dynamics of North American closed-end real estate funds over…

03.09.2026
Warren Buffett once implored investors to “be greedy when others are fearful,” and this sage advice is certainly applicable to…

03.02.2026
Recent market dynamics in the software sector reflect a sharp shift in investor sentiment driven primarily by concerns that advances…

02.23.2026
Most have traditionally viewed a successful exit for a venture-backed start-up as either an IPO or an acquisition by a…
02.17.2026
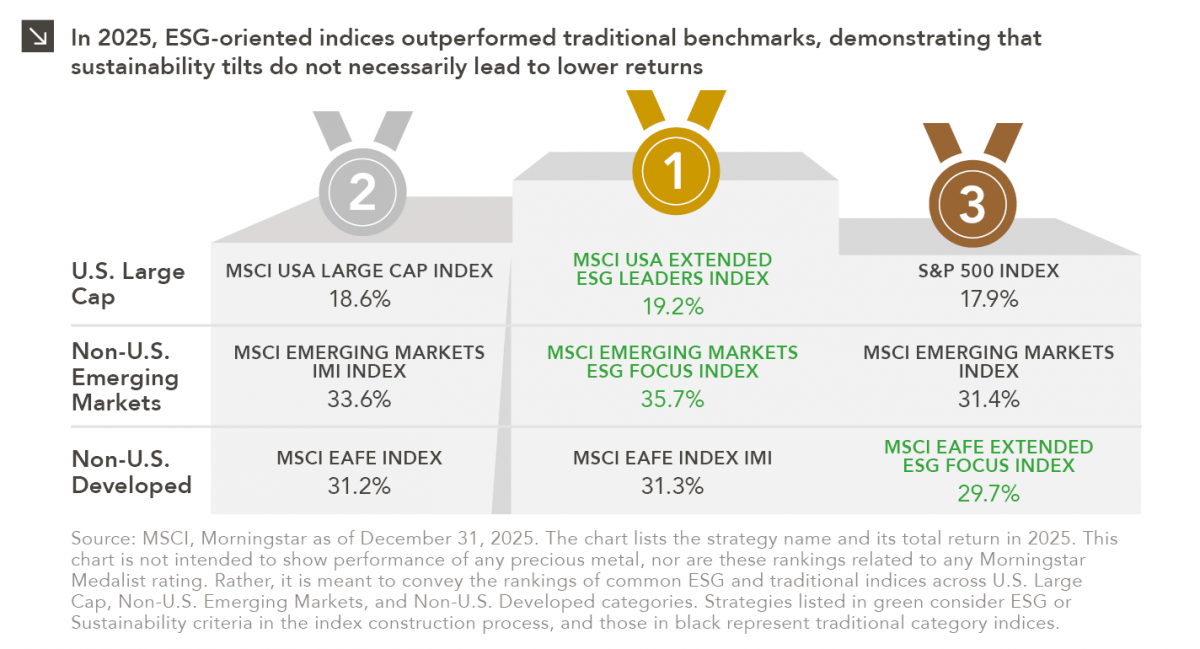
Performance is a key attribute of any investment strategy with a values-based or sustainability focus. As such, analyzing the 2025…
Research alerts keep you updated on our latest research publications. Simply enter your contact information, choose the research alerts you would like to receive and click Subscribe. Alerts will be sent as research is published.
We respect your privacy. We will never share or sell your information.
If you have questions or need further information, please contact us directly and we will respond to your inquiry within 24 hours.
Contact Us >