11.02.2026
The Haunting of Emerging Markets
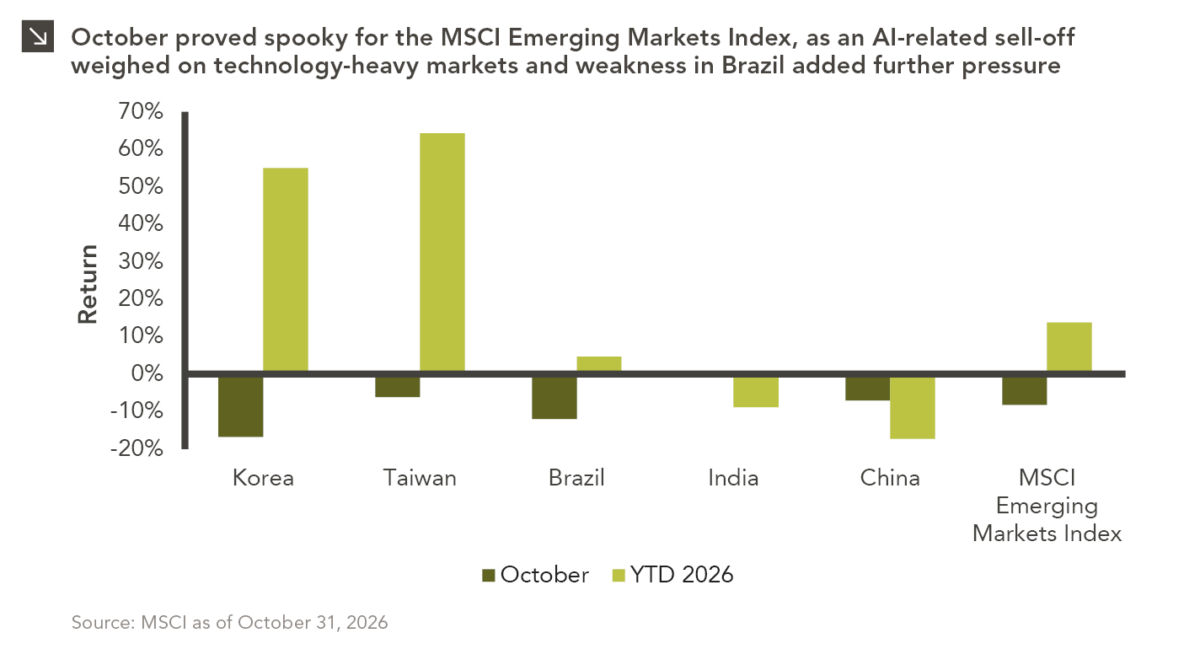
Emerging markets faced a challenging October, with the space declining by around 8.3% amid renewed concerns over the sustainability of…


U.S. venture capital deployment in 2021 smashed the previous record set in 2020, as $329.8 billion of funds were infused (+98% from 2020) into over 15,500 deals (+27% from 2020). While this tremendous volume of investment was deployed across the market, late-stage deals in particular raised over $100 million in capital in the last year. In fact, within the U.S. venture capital market, the substantial amount of late-stage venture deployment alone eclipsed the previous overall deployment record by 15%, as $190.8 billion of investments were deployed across 4,704 late-stage deals during 2021.
The growth trajectory of the late-stage venture capital market has been steadily climbing over the past decade as part of a broader evolution of the space, as private market companies have become larger and more durable due to capital availability, increased transparency, and minimal reporting requirements. That being said, the market may have now reached a size at which investors could begin to view early-stage venture capital and late-stage growth equity as distinct asset classes given the different investment considerations associated with each (e.g., duration, risk, returns, etc.) and separate the two within portfolios. Indeed, as late-stage deals become larger in size they become increasingly different investments, as many growth companies that have previously been supported by early-stage venture investors evolve into more established businesses with substantial revenues, proven product-market fits, much shorter duration (five years or fewer), lower loss potential, and valuations that are more aligned with public market peers.
As the venture capital market continues to expand due to new participants and existing investors increasing their allocations to the space, it is worth considering allocation mixes within portfolios with an eye toward having specific and dedicated early- and late-stage venture capital deployment targets.
Print PDF > 2021 Smashes VC Records as Late-Stage Deals Reshape the Market
The opinions expressed herein are those of Marquette Associates, Inc. (“Marquette”), and are subject to change without notice. This material is not financial advice or an offer to purchase or sell any product. Marquette reserves the right to modify its current investment strategies and techniques based on changing market dynamics or client needs.
11.02.2026
Emerging markets faced a challenging October, with the space declining by around 8.3% amid renewed concerns over the sustainability of…
10.26.2026
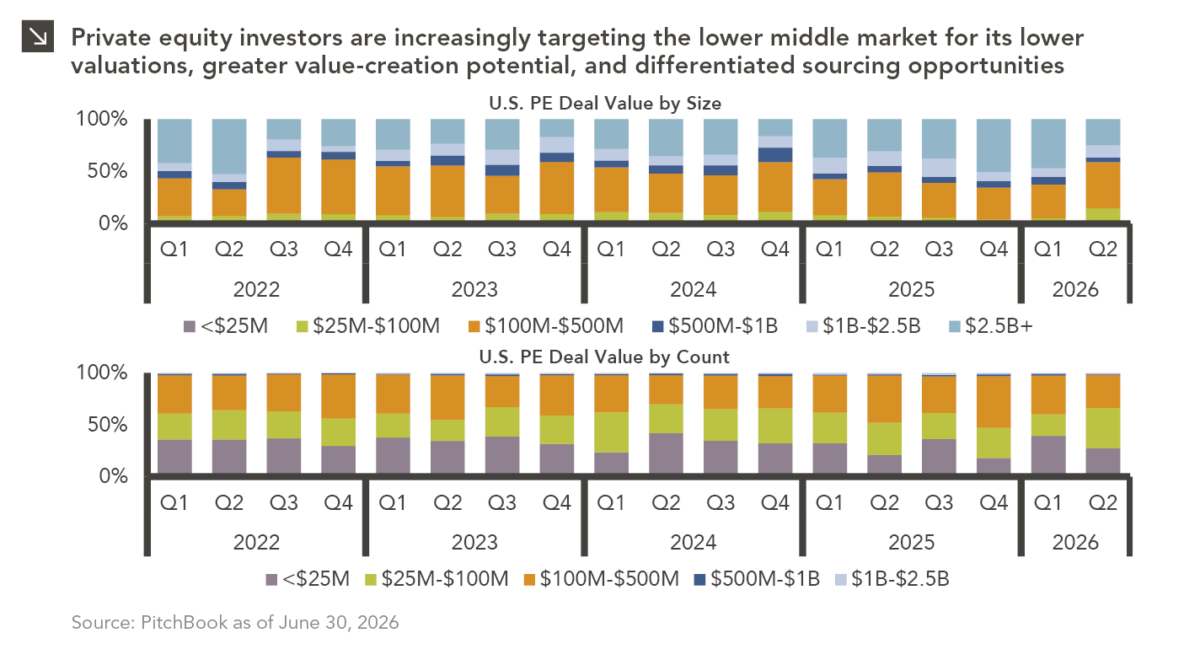
Private equity activity is increasingly shifting toward smaller transactions, with total deal value for transactions of $100 million or less…

10.08.2026
This video is a recording of a live webinar held October 22 by Marquette’s research team analyzing the third quarter…
10.19.2026
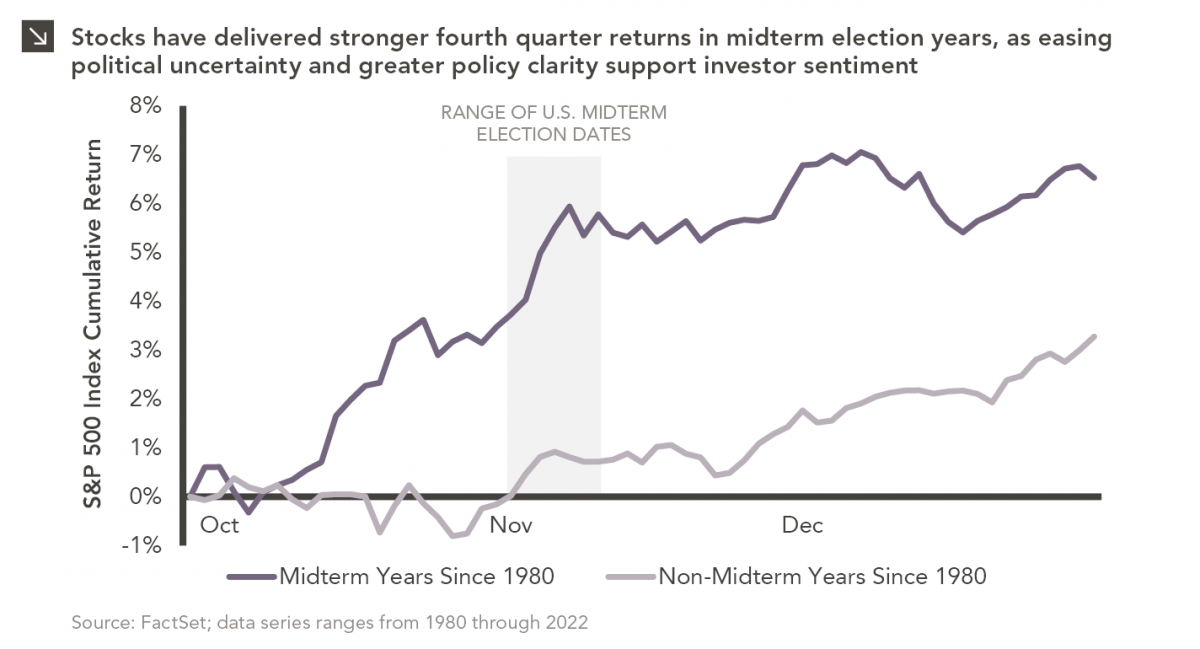
Since 1980, the S&P 500 Index has generally performed well in the weeks surrounding U.S. midterm elections. Specifically, the index…
10.12.2026
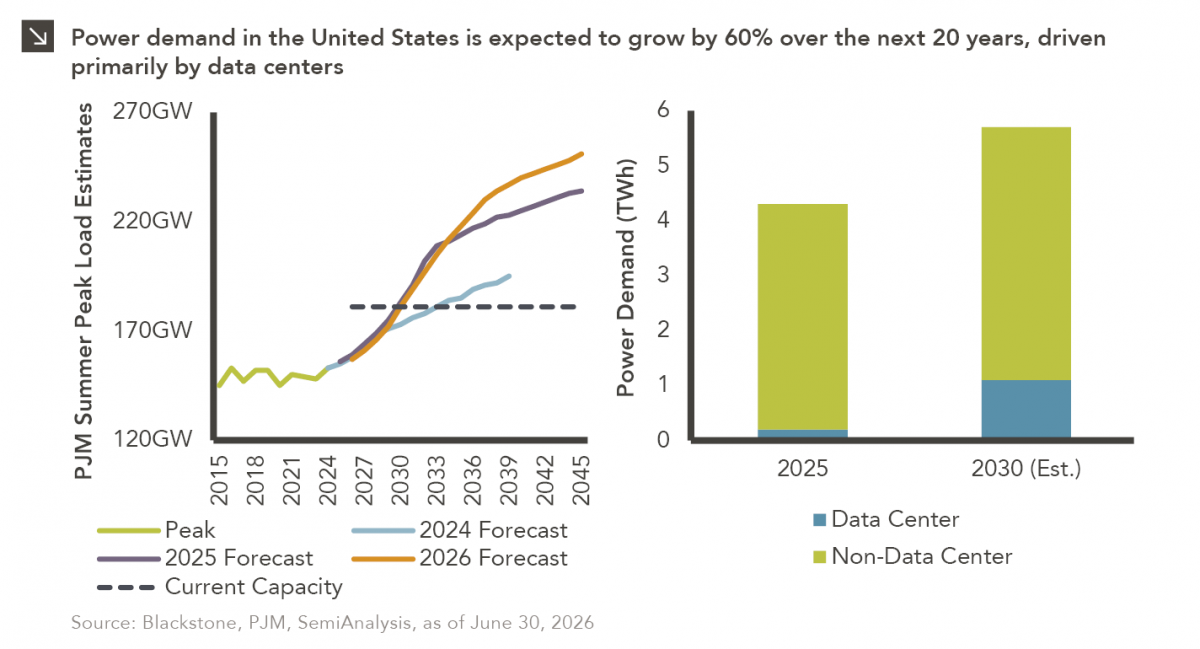
This week’s chart highlights the accelerating growth of electricity demand in the U.S., which has been driven primarily by the…
10.05.2026
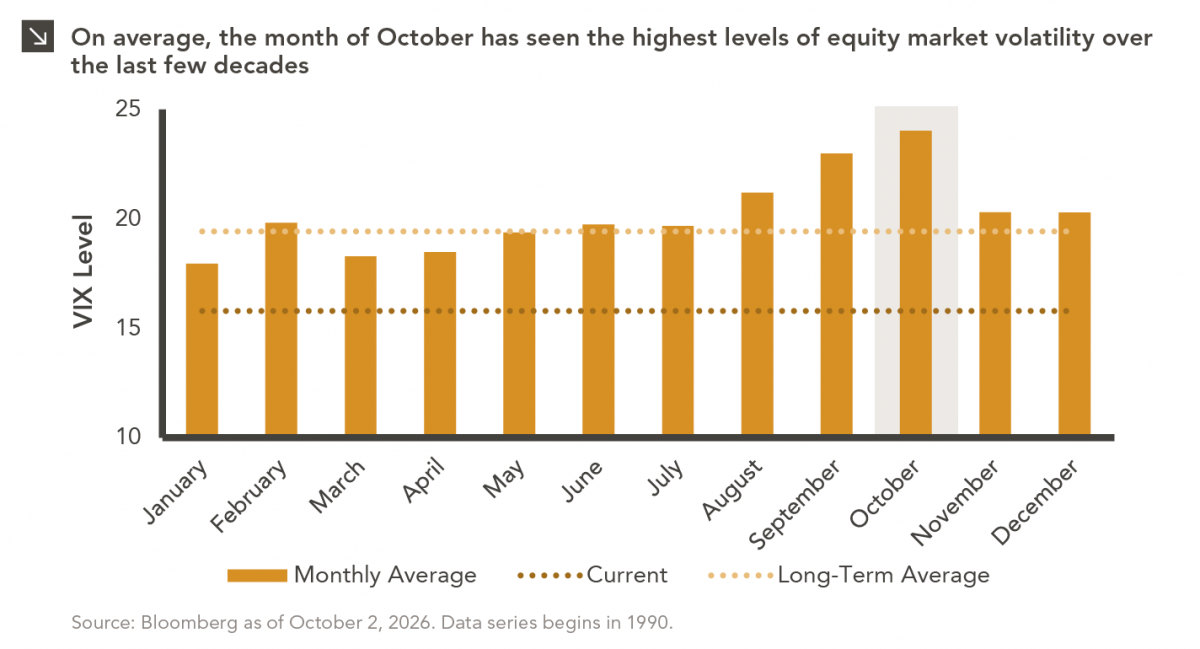
For investors, the spookiest thing about October might not be the ghosts and monsters that are bound to show up…
Research alerts keep you updated on our latest research publications. Simply enter your contact information, choose the research alerts you would like to receive and click Subscribe. Alerts will be sent as research is published.
We respect your privacy. We will never share or sell your information.
If you have questions or need further information, please contact us directly and we will respond to your inquiry within 24 hours.
Contact Us >