James Torgerson
Senior Research Analyst
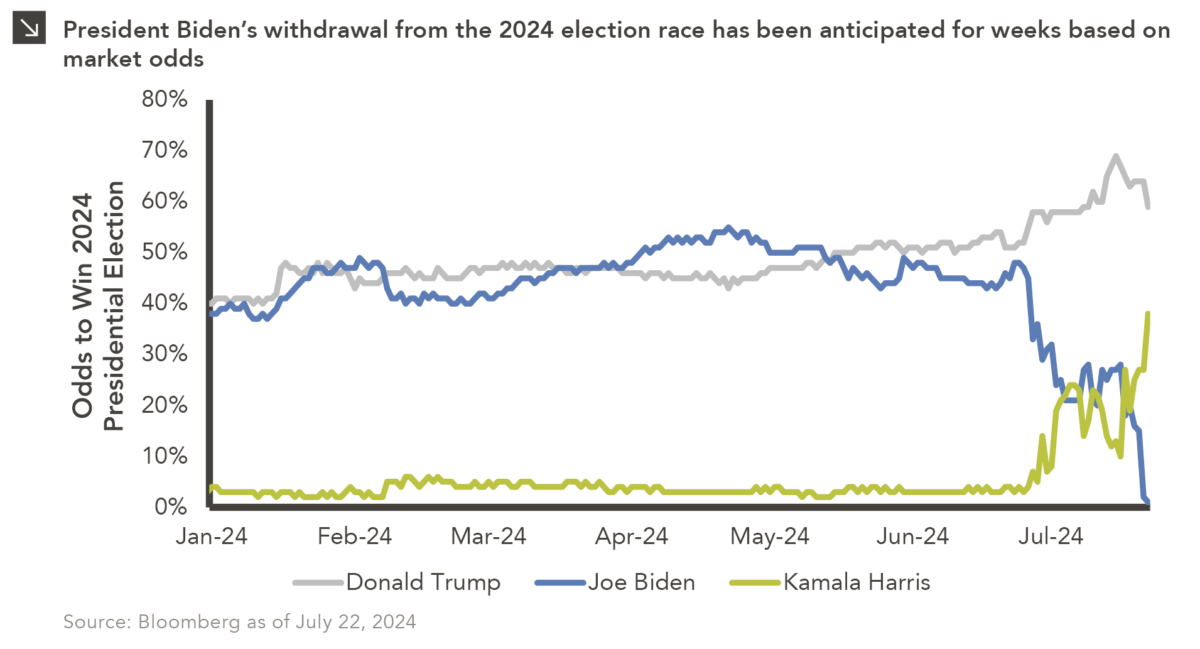
President Joe Biden announced yesterday that he is dropping out of the presidential race and will not seek the Democratic nomination for president. The last time a sitting president declined to seek re-election was Lyndon Johnson in 1968. However, this move comes with little surprise to those who have been paying attention to the odds market. In fact, the market “priced in” this decision shortly after Biden’s shaky debate performance with former President Donald Trump just over a month ago.
The data series in this week’s chart tracks the implied probabilities available on the PredictIt website. For most of 2024, odds for Biden or Trump to win the election fluctuated between ~40–55%. Trump gained momentum leading up to the debate as questions surrounding Biden’s capacity to serve another term swirled. Biden’s disastrous performance accelerated Trump’s chances and sent the president’s odds of winning the election into a freefall.
Before this weekend’s announcement, recent expectations were that Vice President Kamala Harris had equal or better odds of winning the Democratic nomination than Biden. Reality now matches that expectation as she is the presumptive Democratic nominee after Biden gave her his endorsement. It remains to be seen whether Biden will finish out his term or if another candidate will challenge Harris at the upcoming Democratic National Convention. Even with the Democratic party throwing its support behind her, Harris has an uphill climb to overtake Trump. Her odds of winning in November currently stand at 38% versus 59% for Trump. The former president’s odds peaked after the assassination attempt on July 13 at 69% and have since fallen after the Republican National Convention and Biden’s withdrawal. This reflects the fact that it may be more difficult to defeat a candidate other than Biden.
How the stock and bond markets reacted to the shifting odds after the debate was predictable in hindsight. The Trump Trade — which includes a steepening of the yield curve, a rally in small-cap equities, and a rotation out of tech stocks into “old economy” sectors, among other trends — was back on. As Biden faltered, sectors and strategies benefitting from Trump and Republicans’ preference of looser fiscal policy, higher tariffs, more aerospace and defense spending, as well as weaker regulations saw tailwinds as investors piled into the Trump Trade. Now the market outlook is much less certain. While Trump still has favorable odds to win the election, Democrats almost certainly have a better chance to keep the White House without Biden. In addition, it is less likely that Republicans will also gain control of Congress.
Trump may not be as likely to beat a non-Biden candidate, which is causing investors to potentially recalibrate their bets on the Trump Trade. Which sectors ultimately benefit from the shakeup to the presidential race remains to be seen. As the odds show, Biden dropping out was expected. For investors wondering what to expect now, a word of advice: Between now and November only expect the unexpected.
Print PDF
The opinions expressed herein are those of Marquette Associates, Inc. (“Marquette”), and are subject to change without notice. This material is not financial advice or an offer to purchase or sell any product. Marquette reserves the right to modify its current investment strategies and techniques based on changing market dynamics or client needs.

07.27.2026
The rapid growth of non-traded business development companies (BDCs), which are investment vehicles that pool investor capital to make loans…

07.24.2026
This video is a recording of a live webinar held July 23 by Marquette’s research team analyzing the first half…
07.22.2026
The usual midyear version of these letters has touched on year-to-date performance as well as the most influential macroeconomic and…

07.20.2026
Our most recent Chart of the Week publication discussed how the AI investment opportunity has expanded beyond…

07.13.2026
One of the enduring lessons of the California Gold Rush is that the greatest fortunes were often made not by…

07.06.2026
Since traditional exit routes have remained constrained in recent years due to higher interest rates, valuation gaps, and a subdued…
Research alerts keep you updated on our latest research publications. Simply enter your contact information, choose the research alerts you would like to receive and click Subscribe. Alerts will be sent as research is published.
We respect your privacy. We will never share or sell your information.
If you have questions or need further information, please contact us directly and we will respond to your inquiry within 24 hours.
Contact Us >