The Emergence of Infrastructure

November 04, 2011 | Miguel Zarate, Partner

A briefing on the infrastructure asset class and key points from our newly published position paper.

To view this article please Login or Register

The opinions expressed herein are those of Marquette Associates, Inc. (“Marquette”), and are subject to change without notice. This material is not financial advice or an offer to purchase or sell any product. Marquette reserves the right to modify its current investment strategies and techniques based on changing market dynamics or client needs.

Related Content

Chart #1 - Line chart showing PJM summer peak load estimates in gigawatts (GW) from 2015 to 2045. The chart compares historical peak load, current capacity, and forecasts from 2024, 2025, and 2026, showing projected demand rising above current capacity over time. Chart #2 - Stacked bar chart showing U.S. power demand in terawatt-hours (TWh) for 2025 and estimated demand in 2030. The chart compares data center and non-data center demand, showing total power demand increasing over the period.

10.12.2026

The Power Demand Supercycle

This week’s chart highlights the accelerating growth of electricity demand in the U.S., which has been driven primarily by the…

10.08.2026

3Q 2026 Market Insights Webinar

LIVE WEBINAR — OCTOBER 22 Please join Marquette’s research team for our 3Q 2026 Market Insights Webinar…

07.24.2026

2026 Halftime Market Insights

This video is a recording of a live webinar held July 23 by Marquette’s research team analyzing the first half…
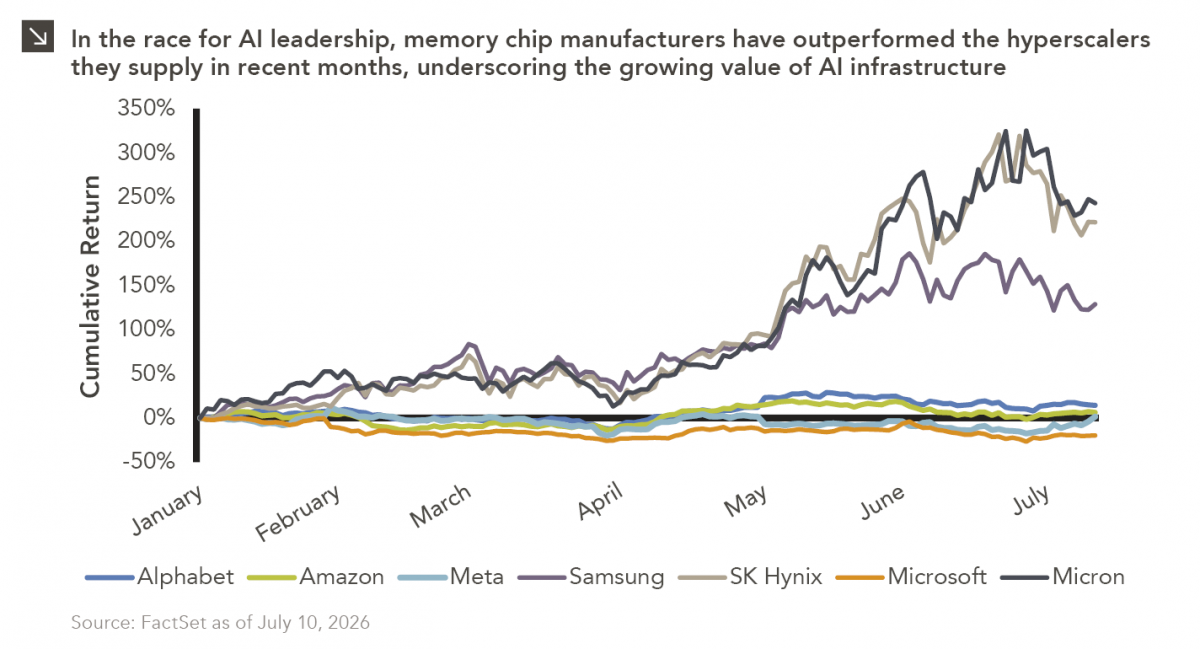
Seven-line chart showing cumulative return for Alphabet, Amazon, Meta, Samsung, SK Hynix, Microsoft, and Micron from January 2026 through July 10, 2026. Samsung, SK Hynix, and Micron have all outperformed other companies shown, highlighting the increasing demand for hardware in the current surge of AI-related infrastructure manufacturing. For full dataset, please contact marquettemarketing@marquetteassociates.com.

07.13.2026

The Modern Gold Rush

One of the enduring lessons of the California Gold Rush is that the greatest fortunes were often made not by…
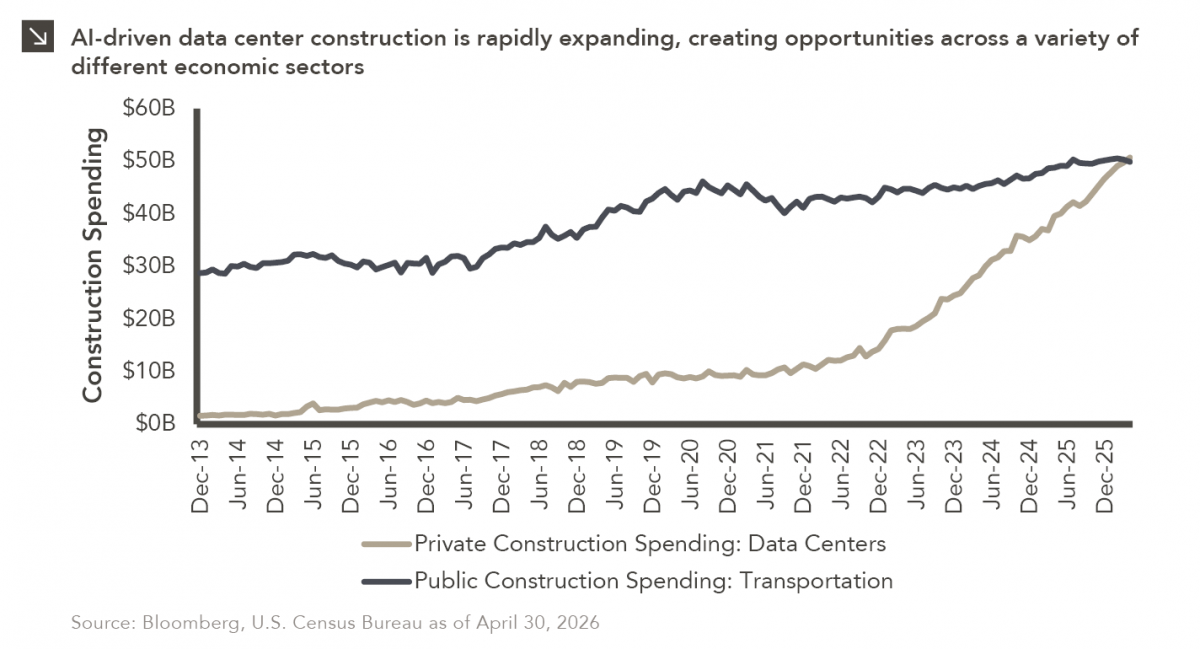
Two-line chart showing Private Construction Spending for Data Centers and Public Construction Spending for Transportation from December 2013 to present in billions of dollars. Data Centers in 2013 were $1.6 billion and Transportation was $28.7 billion. Since 2022, Data Center spending has increased quickly; Transportation has increased overall but relatively steadily. April 30, 2026 data point for Data Centers was 50.7, while Transportation was 49.9. For full dataset, please contact marquettemarketing@marquetteassociates.com.

06.15.2026

Centers of Attention

The rapid buildout of artificial intelligence infrastructure is reshaping the U.S. investment landscape. According to recent Census Bureau data, spending…
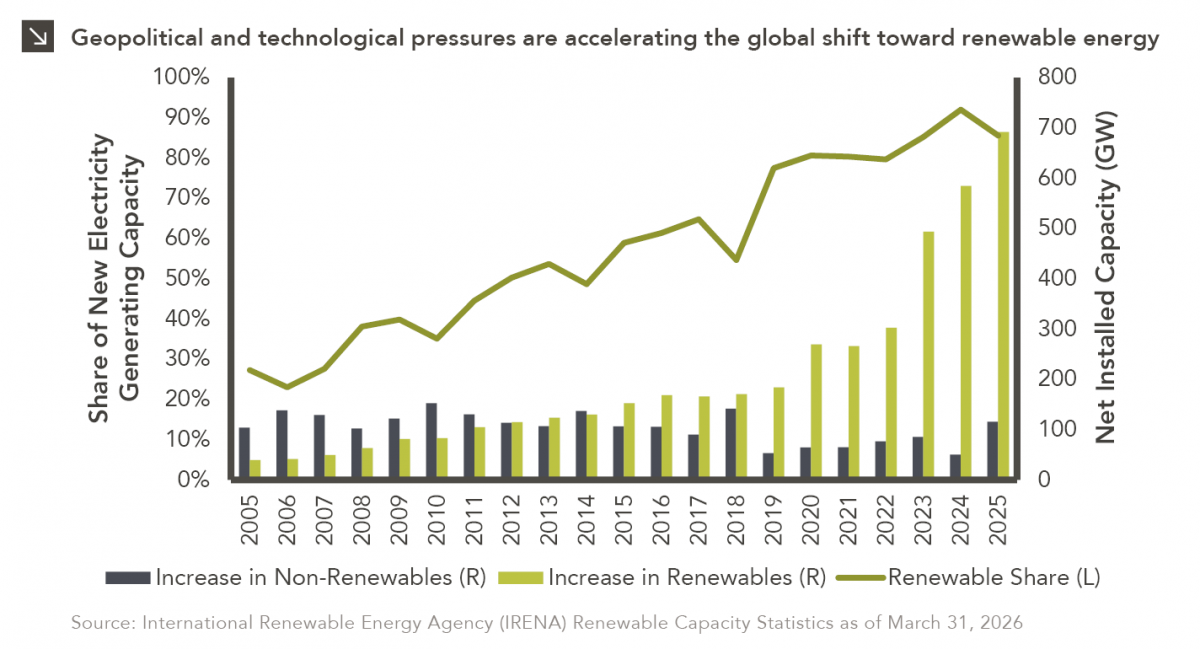
Combination column and line chart showing increase in non-renewables and renewables in net installed capacity (GW) in columns and share of new electricity generating capacity by renewables (line) annually since 2005. Renewables ave seen a marked increase in recent years (183.95GW in 2019 to 691.94GW in 2025). Renewable Share was at 86% for 2025. For full dataset, please contact marquettemarketing@marquetteassociates.com.

05.11.2026

A Renewed Focus on Renewables

In addition to the humanitarian toll of the conflict in Iran, the world is currently confronting the impact that trade…

More articles

Subscribe to Research Email Alerts

Research Email Alert Subscription

Research alerts keep you updated on our latest research publications. Simply enter your contact information, choose the research alerts you would like to receive and click Subscribe. Alerts will be sent as research is published.

We respect your privacy. We will never share or sell your information.

Thank You

We appreciate your interest in Marquette Associates.

If you have questions or need further information, please contact us directly and we will respond to your inquiry within 24 hours.

Contact Us >

