Don’t Forget About Those Old 401(k) Accounts!

December 09, 2021 | Matt Nowak, AIF®, Associate Director of Defined Contribution

Combination line/column chart showing forgotten 401(k) accounts and associated assets. Chart subtitle: As 2021 draws to a close, plan sponsors should look to begin the new year by helping employees consolidate retirement accounts. Chart description: Left Y-axis shows number of accounts in millions ranging from 0 to 30. X axis shows years from 2013 to 2021. Right Y-axis shows assets in trillion dollars, from 0 to $1.6 trillion. Across both categories, numbers have increased steadily since 2013; in 2021 (as of May), an estimated $1.35 trillion dollars are being held in over 24 million 401(k) accounts. Chart Source: Capitalize Money, Inc., The True Cost of Forgotten 401(k) Accounts white paper; data as of May 31, 2021.

According to a recent study conducted by Capitalize, $1.35 trillion worth of assets were held in forgotten 401(k) accounts as of May 31st, 2021. This figure is based on estimates of 24.3 million retirement accounts with an average balance of $55,400 per account. Based on this study, it is evident that millions of participants are missing out on additional retirement savings each year their old accounts are left behind with previous employer plans, since holding multiple accounts often leads to investors incurring higher fees. To that point, Capitalize estimates that an individual could experience up to $700,000 in foregone retirement savings as a result of forgotten 401(k) accounts. As 2021 draws to a close, plans sponsors should look to begin the new year by helping employees consolidate retirement accounts, which could lead to cost savings and the accumulation of plan assets, by utilizing the following tactics:

  • Confirm participant data, including email and mailing addresses, is up to date to ensure communications will be received
  • Collaborate with the relationship manager of your retirement plan recordkeeper to develop a targeted participant communication strategy (email, hard copy mail, or onsite visits) that highlights the benefits of consolidating retirement accounts from previous employers
  • Ensure communications clearly explain the process for rolling over outside retirement assets
    · Paperwork required to effectuate rollovers can be confusing to many participants, however, the majority of recordkeepers employ support teams available to assist individuals with transfers
    · The phone numbers and email addresses of these support teams should be clearly identified in communications to participants
  • To increase the chances of success when it comes to participant rollovers, communication campaigns should be continued throughout the entire year

Finally, technological developments and the reporting capabilities of retirement plan recordkeepers will allow plan sponsors to measure the effectiveness of these campaigns. By the end of 2022, sponsors should review results related to the number of rollovers completed, the amount of assets gained, and the extent to which employees were actively engaged with the topic during the year. This may help plans delineate future goals and better understand the most effective ways to communicate to participants.

If this is of interest to your plan, please contact your Marquette consultant for additional information.

Print PDF > Don’t Forget About Those Old 401(k) Accounts!


The opinions expressed herein are those of Marquette Associates, Inc. (“Marquette”), and are subject to change without notice. This material is not financial advice or an offer to purchase or sell any product. Marquette reserves the right to modify its current investment strategies and techniques based on changing market dynamics or client needs.


Matt Nowak, AIF®
Associate Director of Defined Contribution

Get to Know Matt

The opinions expressed herein are those of Marquette Associates, Inc. (“Marquette”), and are subject to change without notice. This material is not financial advice or an offer to purchase or sell any product. Marquette reserves the right to modify its current investment strategies and techniques based on changing market dynamics or client needs.

Related Content

Line chart comparing S&P 500 Index cumulative returns for midterm and non-midterm election years since 1980. The x-axis shows October through December, and the y-axis shows S&P 500 Index cumulative return, ranging from -1% to 8%. For full dataset, please contact marquettemarketing@marquetteassociates.com.

10.19.2026

Divided We Rise?

Since 1980, the S&P 500 Index has generally performed well in the weeks surrounding U.S. midterm elections. Specifically, the index…

Chart #1 - Line chart showing PJM summer peak load estimates in gigawatts (GW) from 2015 to 2045. The chart compares historical peak load, current capacity, and forecasts from 2024, 2025, and 2026, showing projected demand rising above current capacity over time. Chart #2 - Stacked bar chart showing U.S. power demand in terawatt-hours (TWh) for 2025 and estimated demand in 2030. The chart compares data center and non-data center demand, showing total power demand increasing over the period.

10.12.2026

The Power Demand Supercycle

This week’s chart highlights the accelerating growth of electricity demand in the U.S., which has been driven primarily by the…

10.08.2026

3Q 2026 Market Insights Webinar

LIVE WEBINAR — OCTOBER 22 Please join Marquette’s research team for our 3Q 2026 Market Insights Webinar…

Bar chart showing average monthly VIX levels from 1990 through October 2026. The x-axis displays months of the year from January through December, and the y-axis displays VIX level. October has the highest average VIX level among all months, while April has the lowest. The chart also includes a current VIX level and a long-term average VIX level for comparison. Source: Bloomberg as of October 2, 2026. Data series begins in 1990. For full dataset, please contact marquettemarketing@marquetteassociates.com.

10.05.2026

Spooky Season

For investors, the spookiest thing about October might not be the ghosts and monsters that are bound to show up…

Line chart showing 10-year U.S. Treasury rate, 5-year/5-year breakeven inflation rate, and 10-year real yield from December 2025 through September 2026. The left axis shows rates from 3.6% to 5.4%, and the right axis from 1.6% to 3.0%. The Treasury rate and real yield rise notably in late 2026, while the breakeven inflation rate remains relatively range-bound around 2.3%–2.4%. For full dataset, please contact marquettemarketing@marquetteassociates.com.

09.28.2026

Getting Real on Inflation

The phrase “expectations of higher inflation” has become a staple in financial news to explain the increase in nominal U.S….
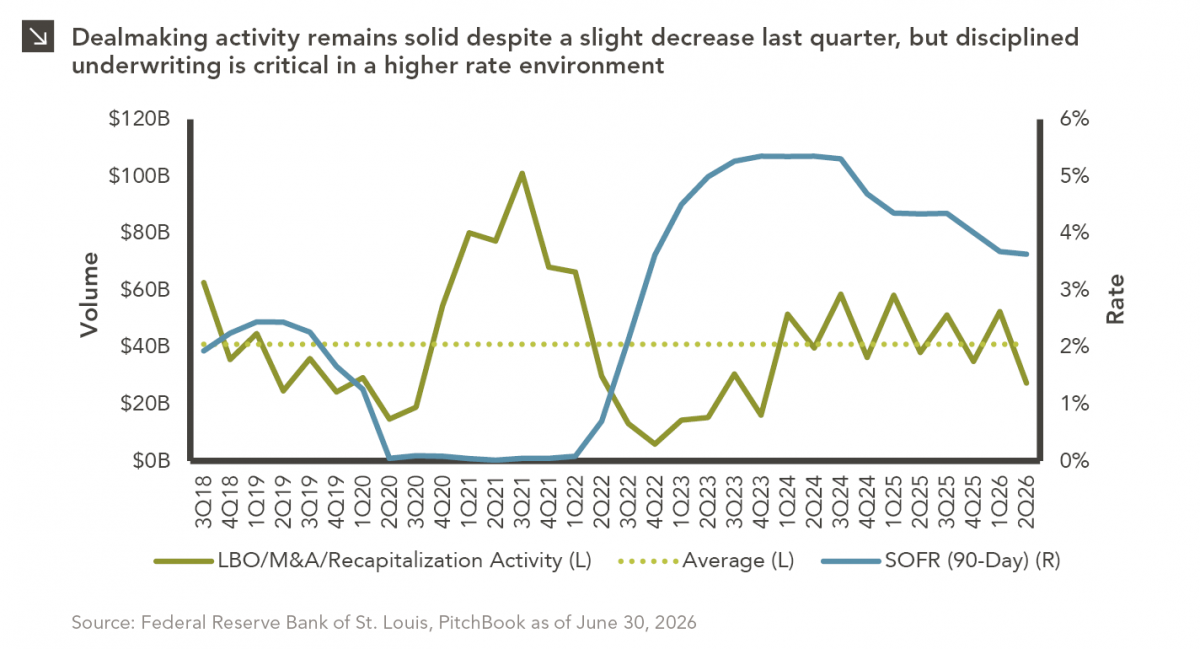
Dual-axis line chart comparing LBO/M&A/Recapitalization Activity, its average level, and the SOFR (90-Day) rate from 3Q18 through 2Q26. LBO/M&A/Recapitalization Activity ranges from approximately $0 billion to $100 billion, while SOFR ranges from 0% to approximately 5%. For full dataset, please contact marquettemarketing@marquetteassociates.com.

09.21.2026

Let’s Make a Deal

For much of the past several years, the conventional view has been that higher interest rates and stretched valuations would…

More articles

Subscribe to Research Email Alerts

Research Email Alert Subscription

Research alerts keep you updated on our latest research publications. Simply enter your contact information, choose the research alerts you would like to receive and click Subscribe. Alerts will be sent as research is published.

We respect your privacy. We will never share or sell your information.

Thank You

We appreciate your interest in Marquette Associates.

If you have questions or need further information, please contact us directly and we will respond to your inquiry within 24 hours.

Contact Us >