Julia Sheehan
Associate Research Analyst
Get to Know Julia


The U.S. economy has proved more resilient than expected this year, buoyed by ongoing consumer strength. Labor market dynamics and pandemic-era savings have allowed consumers to continue to spend despite higher costs. Those excess savings, however, are projected to be fully depleted by the fourth quarter. On top of that, millions of Americans will soon have another monthly charge to factor into budgets, as student loan payments are set to resume in October for the first time in years.
Collectively, U.S. consumers owe $1.6 trillion in education debt, with monthly payments averaging $200–$300. The CARES Act put student loan payments on hold in 2020, saving consumers approximately $185 billion over the last three years.¹
Moreover, the pause in payments brought delinquency rates to historic lows, which helped improve borrowers’ credit scores, enabling them to take on additional debt. As a result, some consumers are now facing greater obligations that may detract from spending on goods and services. Apollo Global Management estimates that student loan payments alone could reduce consumer spending — which makes up two-thirds of U.S. GDP — by more than $100 billion per year. Whether the U.S. tips into recession remains to be seen, but evolving dynamics like the depletion of excess savings and the resumption of student loan payments could change current trajectories. We will continue to watch these factors and their impact on the macroeconomic outlook closely.
Print PDF > When the Bill Comes Due
¹Goldman Sachs via The New York Times, Student Loan Pause is Ending, With Consequences for Economy
The opinions expressed herein are those of Marquette Associates, Inc. (“Marquette”), and are subject to change without notice. This material is not financial advice or an offer to purchase or sell any product. Marquette reserves the right to modify its current investment strategies and techniques based on changing market dynamics or client needs.

10.27.2025
To paraphrase a quote from former President George W. Bush: “Fool me once, shame on… shame on you. Fool me…

10.22.2025
This video is a recording of a live webinar held October 22 by Marquette’s research team analyzing the third quarter…
10.22.2025
I spent the past weekend at my alma mater to watch them play their biggest rival. Football weekends there are…

10.20.2025
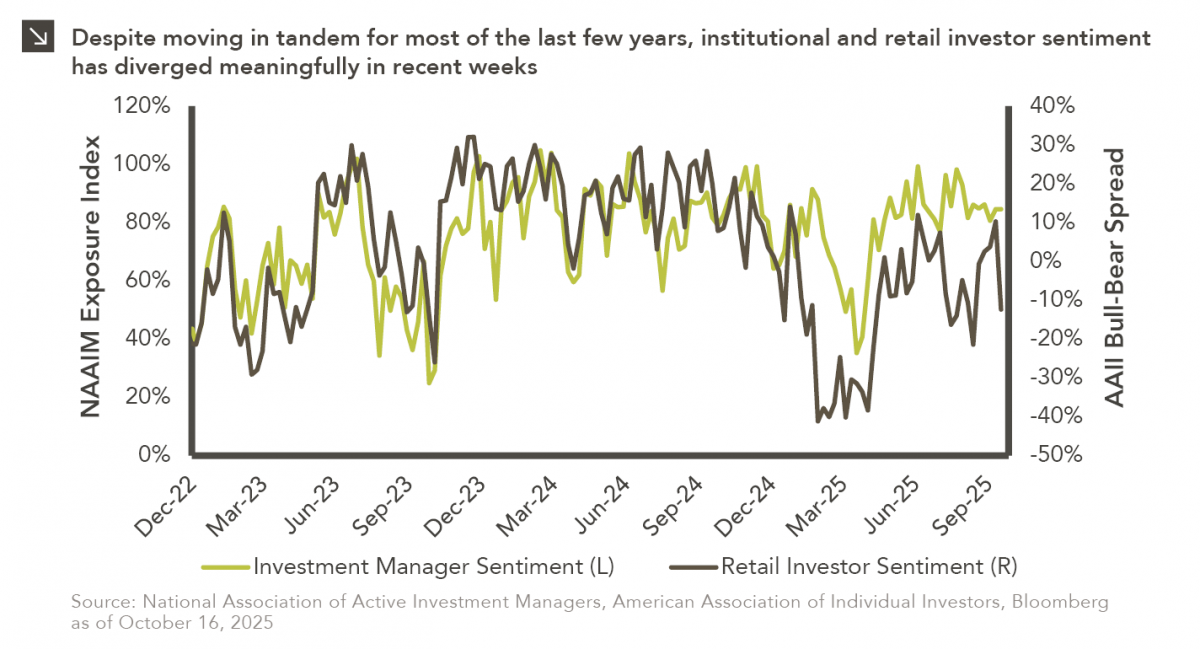
This week’s chart compares institutional and retail investor sentiment using two established indicators. Institutional sentiment is represented by the National…

10.13.2025
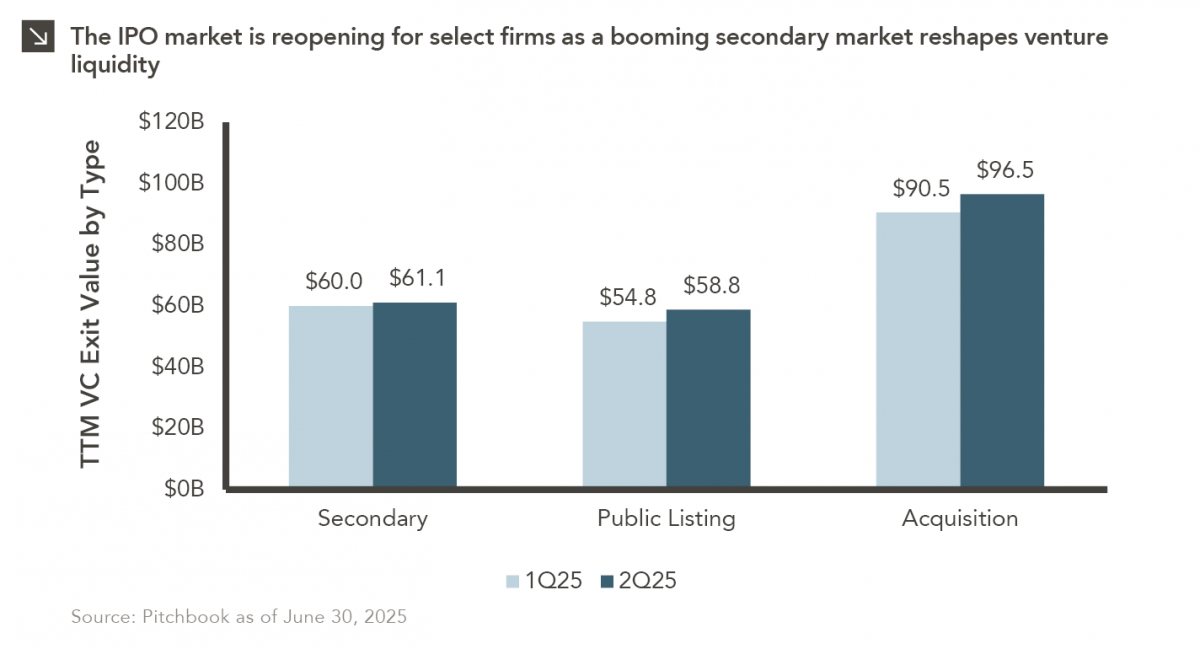
After a three-year drought, the IPO market is stirring again… but only for a select few. Just 18 companies have…

10.06.2025
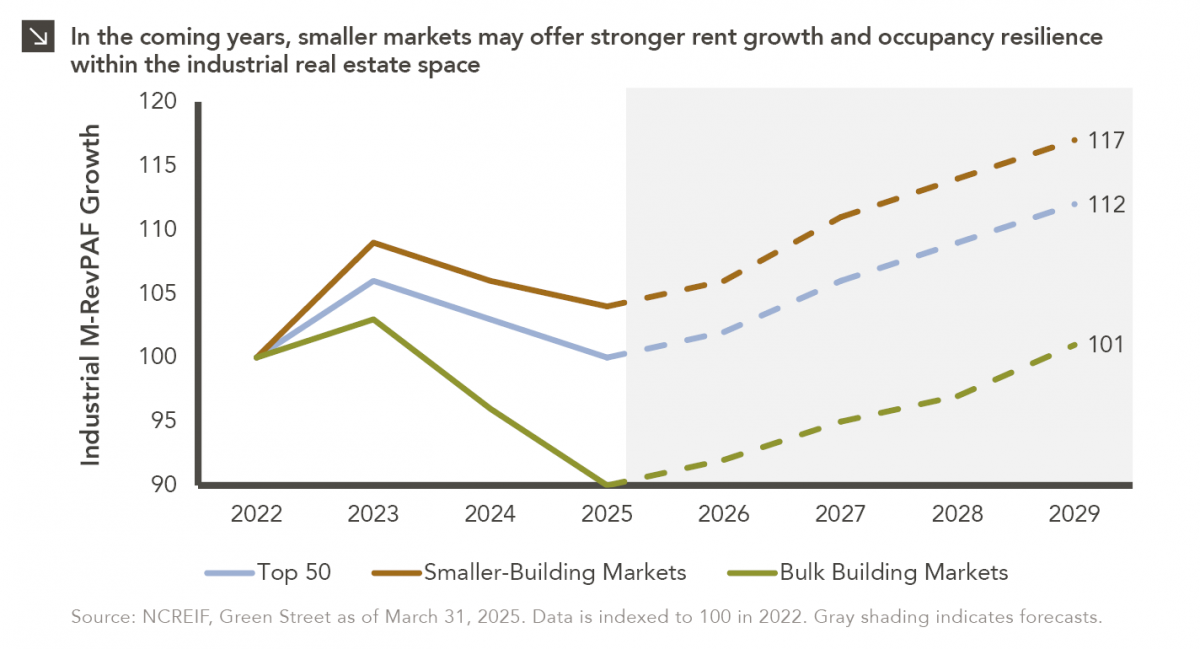
This week’s chart compares realized and expected Market Revenue per Available Foot (“M-RevPAF”) growth within the industrial real estate space…
Research alerts keep you updated on our latest research publications. Simply enter your contact information, choose the research alerts you would like to receive and click Subscribe. Alerts will be sent as research is published.
We respect your privacy. We will never share or sell your information.
If you have questions or need further information, please contact us directly and we will respond to your inquiry within 24 hours.
Contact Us >