Chad Sheaffer, CFA, CAIA
Associate Director of Private Credit


Following last week’s preliminary annual benchmark review from the Bureau of Labor Statistics that suggested U.S. job growth has been weaker than initially estimated, investors have been closely monitoring the labor market for signs of strain. Corporate profit margins may be particularly important to watch as they directly impact the labor market and have historically served as a leading indicator of layoffs and economic frailty.
Using the quarter-over-quarter percentage increase in average initial jobless claims as a proxy for changes in employment, this week’s chart highlights the relationship between the labor market and pre-tax corporate profit margins. Over the past three decades, corporate profit margins have generally trended higher and sit at approximately 12.2% today. While current margins are down slightly from recent cycle peaks, they remain elevated compared to historical levels. This signals that corporate profitability remains relatively robust. Despite challenges caused by higher rates and inflationary pressures, these higher margins have allowed companies to avoid significant layoffs by tapping into other cost-control measures as needed. Given that workforce reductions are often seen as a last resort for companies due to the high costs associated with obtaining, training, and retaining employees, significant layoffs typically do not occur until corporate profit margins have declined precipitously from cycle peaks. The orange line illustrates this point by showing sharp increases in initial jobless claims during economic downturns, including the Dot-Com Bubble, the Global Financial Crisis, and the COVID-19 pandemic, during which quarter-over-quarter jobless claims spiked by an astonishing 165%.
While there were certainly other dynamics at play during each of these recessionary periods, significant increases in layoffs generally coincided with slower growth and material declines in corporate profitability. These trends underscore the importance of monitoring these indicators in tandem.
Print PDF
The opinions expressed herein are those of Marquette Associates, Inc. (“Marquette”), and are subject to change without notice. This material is not financial advice or an offer to purchase or sell any product. Marquette reserves the right to modify its current investment strategies and techniques based on changing market dynamics or client needs.

08.31.2026
Private equity has always had a few portfolio companies that refused to leave the party. Today, however, the industry appears…

08.24.2026
The global bond market is facing renewed pressure as investors demand higher yields to hold long-dated government debt, pushing borrowing…

08.17.2026
As a college football player struggling to put on mass, the “supersizing” deal at McDonald’s was hard to beat. For…

08.10.2026
After reaching nearly ¥164 per dollar, its weakest level in roughly four decades, the yen had become a source of…

08.03.2026
In the cinematic masterpiece Rocky IV, Rocky gets dazed by his opponent, Captain Ivan Drago, and complains that he sees…
07.27.2026
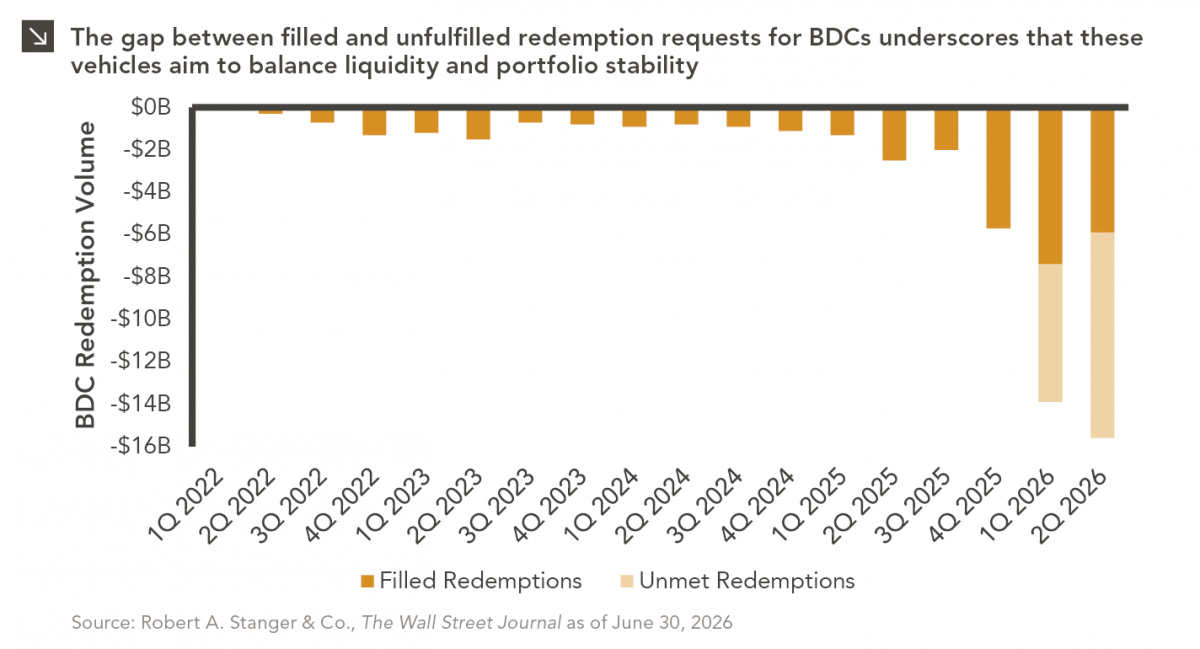
The rapid growth of non-traded business development companies (BDCs), which are investment vehicles that pool investor capital to make loans…
Research alerts keep you updated on our latest research publications. Simply enter your contact information, choose the research alerts you would like to receive and click Subscribe. Alerts will be sent as research is published.
We respect your privacy. We will never share or sell your information.
If you have questions or need further information, please contact us directly and we will respond to your inquiry within 24 hours.
Contact Us >