Nat Kellogg, CFA
President


Active U.S. equity managers regularly point out that the stock market looks expensive, and as a result, they are having trouble finding good companies to buy. Our chart this week looks at the median P/E for the S&P 500 Index over the last decade compared to the current P/E (our E is based on trailing twelve months operating earnings). Not only does the broad index look expensive relative to history, but each of the sectors in the index also appears to be overpriced. But how overpriced? The green bars indicate the price correction needed to bring the index back in-line with the historic median P/E ratio. At current valuation levels it would take a full blown bear market (a price correction over 20%) before the market looks reasonably valued again.
However, there is another way for P/E multiples to normalize over time; an increase in earnings without a change in price. The orange bars show the earnings growth needed to bring the index back in-line with historic valuation ratios. While 27% earnings growth for the S&P may seem optimistic, investors should realize that after seven straight quarters of negative earnings growth from 4Q14 to 2Q16, overall index level earnings are growing again. Year-over-year earnings growth hit 21% in 4Q16 and analysts currently expect S&P 500 earnings to be up 22.6% in 2017.
Lastly, astute observers will notice our analysis excludes two S&P sectors. Real Estate is excluded for a lack of historical data, as it just became a stand-alone sector back in 2016. Energy is excluded because energy sector earnings are currently so low the P/E multiple is essentially meaningless. But investors are expecting energy earnings to bounce back in 2017, and play a key role in driving overall S&P 500 index earnings growth.

The opinions expressed herein are those of Marquette Associates, Inc. (“Marquette”), and are subject to change without notice. This material is not financial advice or an offer to purchase or sell any product. Marquette reserves the right to modify its current investment strategies and techniques based on changing market dynamics or client needs.
07.06.2026
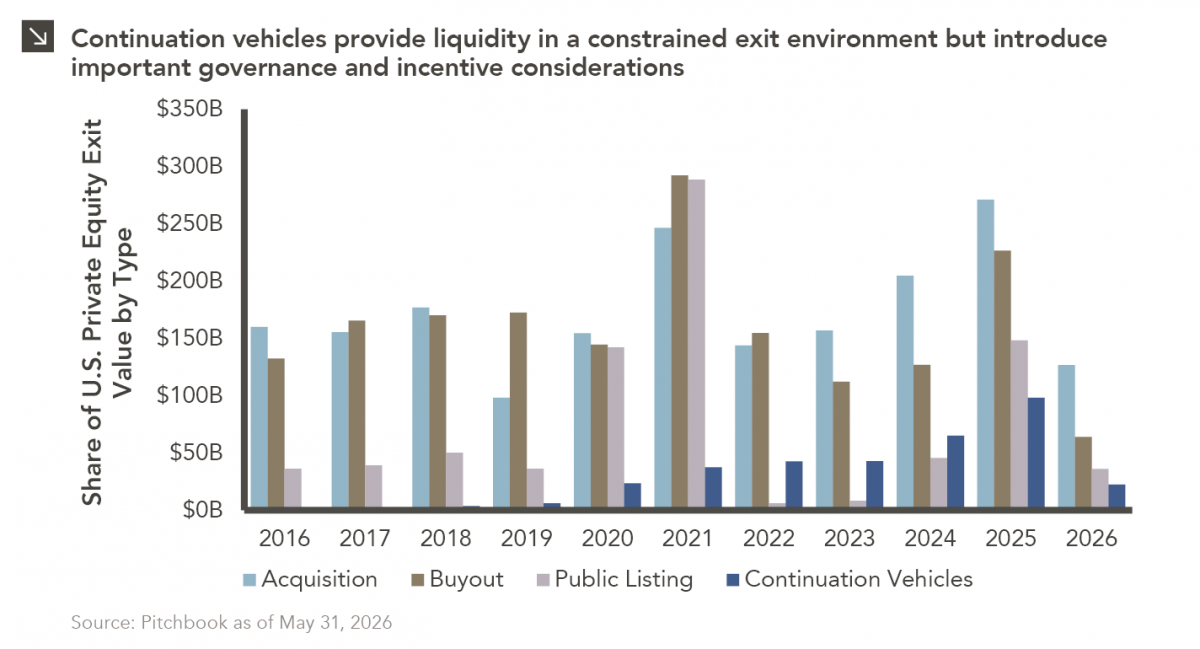
Since traditional exit routes have remained constrained in recent years due to higher interest rates, valuation gaps, and a subdued…
06.29.2026
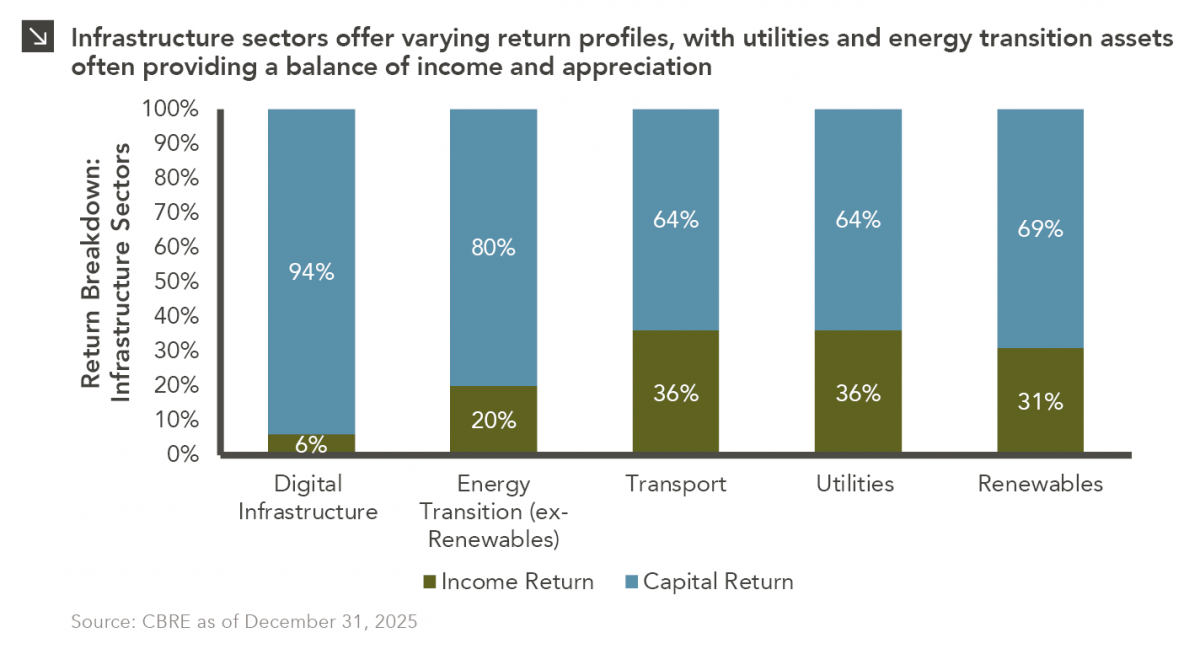
This week’s chart highlights the varying return profiles across key infrastructure sectors by illustrating the split between income and capital…
06.22.2026
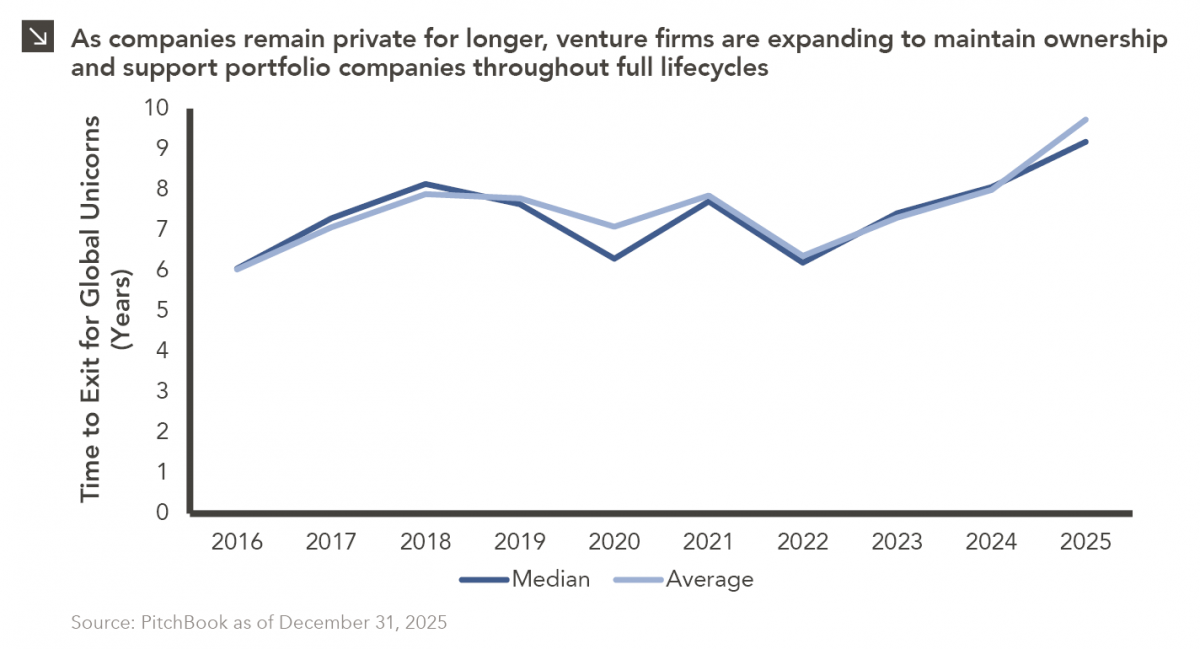
When Benchmark, one of Silicon Valley’s most renowned early-stage venture capital firms, closed $2 billion across two new funds this…
06.15.2026
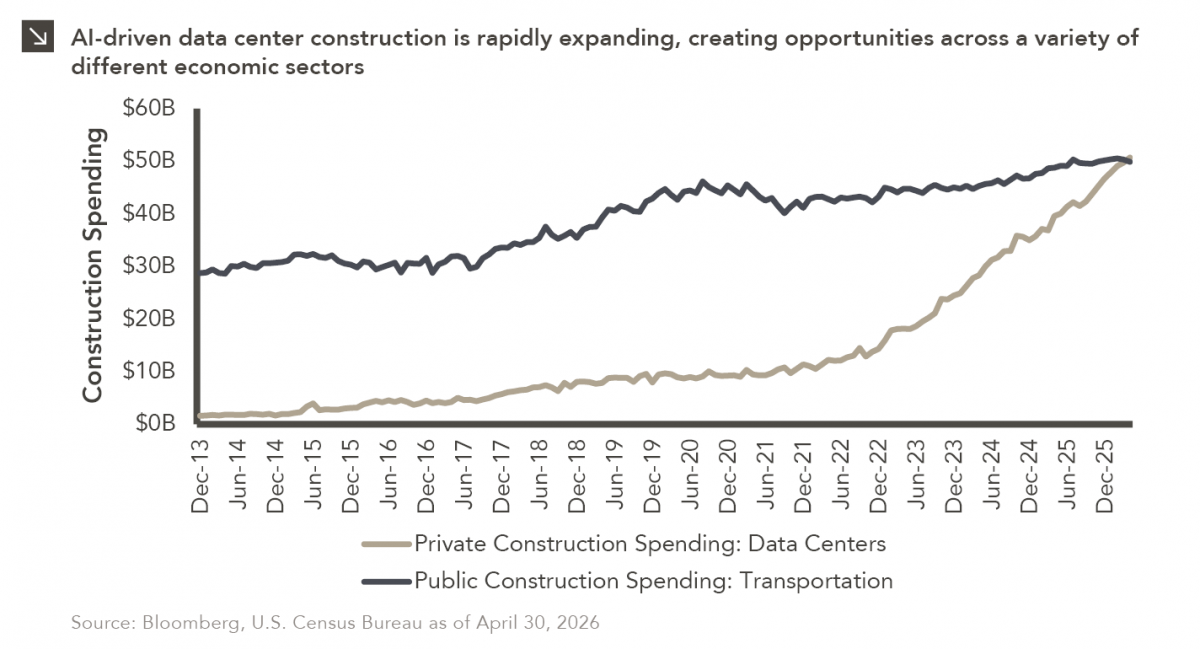
The rapid buildout of artificial intelligence infrastructure is reshaping the U.S. investment landscape. According to recent Census Bureau data, spending…
06.08.2026
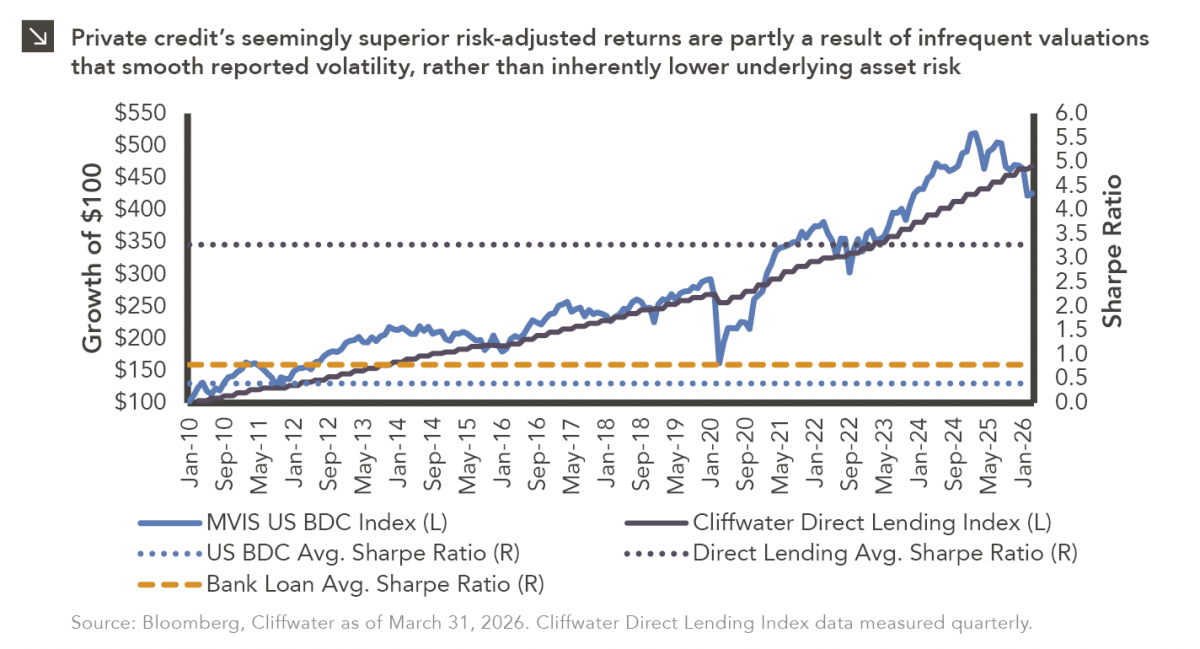
Hi, James Torgerson here! Volatility can be an unsightly blemish on portfolios and lead to inferior risk-adjusted returns. Private credit…
06.01.2026
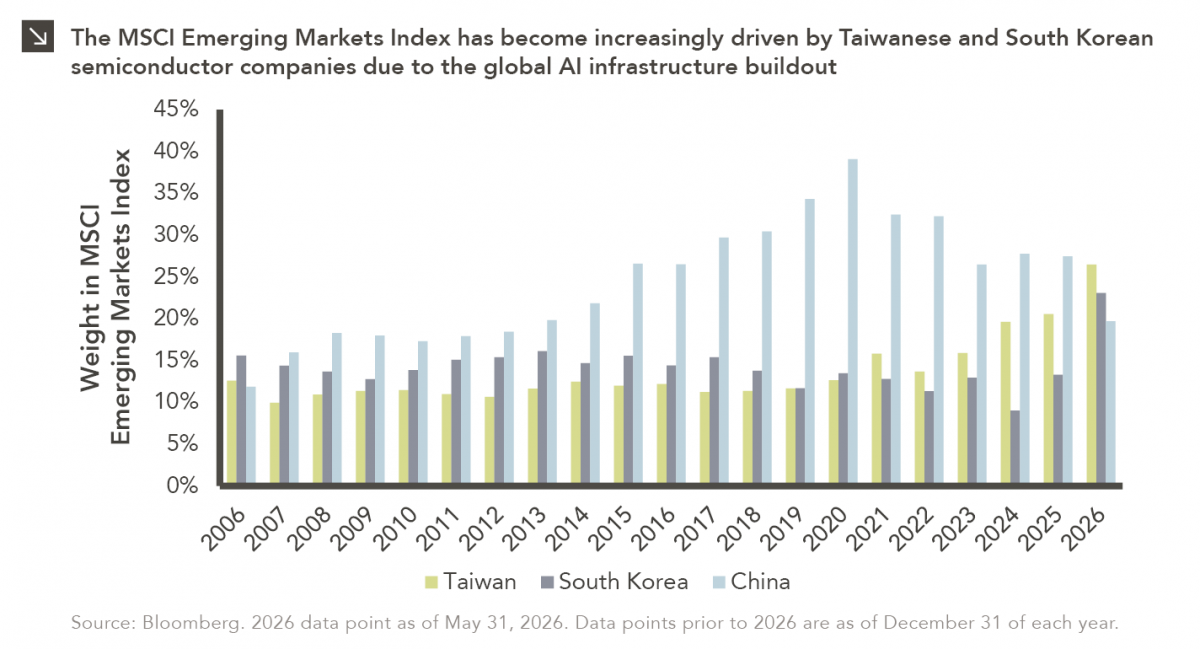
The MSCI Emerging Markets Index has undergone a significant structural transformation in recent years. For much of the past decade,…
Research alerts keep you updated on our latest research publications. Simply enter your contact information, choose the research alerts you would like to receive and click Subscribe. Alerts will be sent as research is published.
We respect your privacy. We will never share or sell your information.
If you have questions or need further information, please contact us directly and we will respond to your inquiry within 24 hours.
Contact Us >