Tom Salemy, CFA, CAIA
Partner


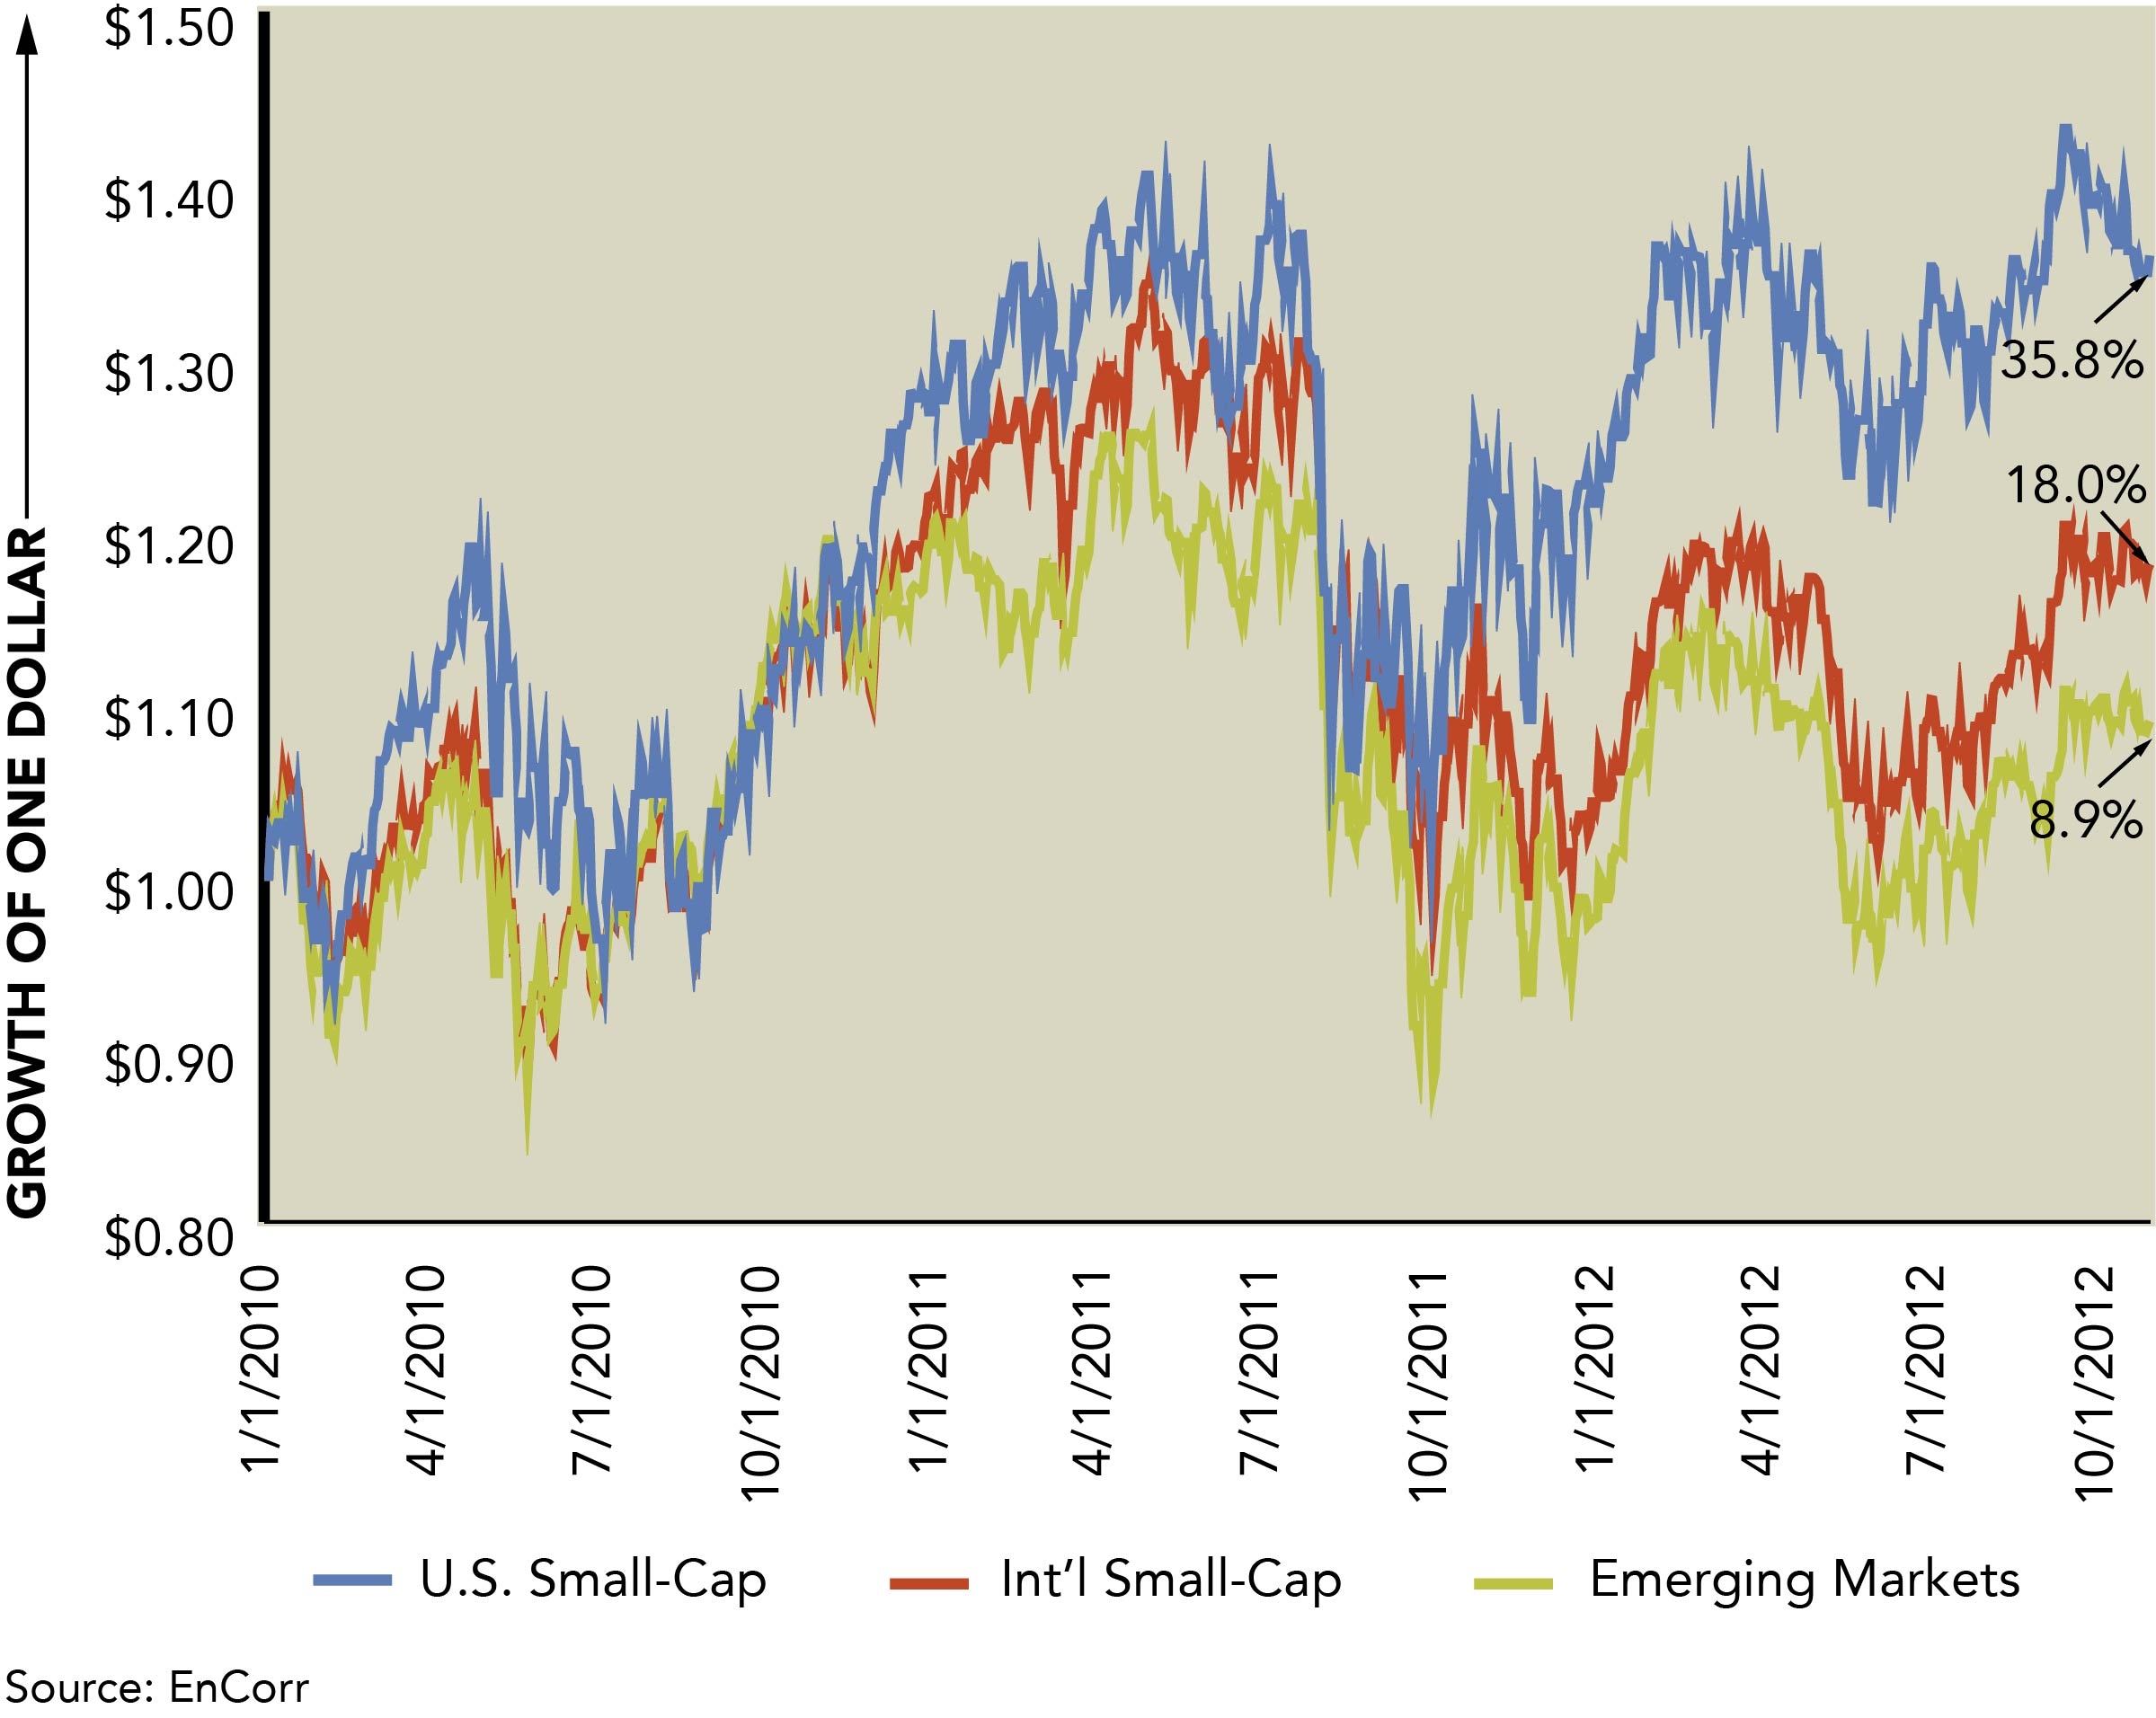
This week’s Chart of the Week highlights the relative underperformance of emerging market stocks compared to other “risky” asset classes. Since January 1, 2010, U.S. small-cap stocks1 have returned a cumulative 35.8% and international small-cap stocks2 have returned a cumulative 18% through October 2012. However, quite surprisingly, emerging market stocks3 are only up 8.9% over the same time-period.
Emerging market equities are still treated as a risk-on, risk-off investment. As the graph above illustrates, it appears that investors have returned to some of the riskier equity markets, but have left emerging markets behind. The underperformance of international small-cap and emerging market stocks compared to U.S. small-cap stocks is somewhat explained by investors’ continued concerns with Europe. However, when looking at one of the traditional valuation metrics, price-to-earnings (“P/E”) ratio, it appears that investors may be unfairly discounting emerging market stocks. As of 9/30/2012, U.S. small-cap, international small-cap, and emerging market stocks had P/E ratios of 33.7, 19.8, and 12.5, respectively.
Continued global economic and policy uncertainty suggests that this trend may persist. However, given their low P/E ratios, coupled with growth rates and fiscal health relative to developed countries, emerging market stocks should deliver long-term compelling returns, despite their recent struggles versus other risky equity indices.
1Represented by the Russell 2000 Index
2Represented by the S&P Developed ex. U.S. Small-Cap Index
3Represented by the MSCI Emerging Markets Index

The opinions expressed herein are those of Marquette Associates, Inc. (“Marquette”), and are subject to change without notice. This material is not financial advice or an offer to purchase or sell any product. Marquette reserves the right to modify its current investment strategies and techniques based on changing market dynamics or client needs.

10.19.2026
Since 1980, the S&P 500 Index has generally performed well in the weeks surrounding U.S. midterm elections. Specifically, the index…

10.12.2026
This week’s chart highlights the accelerating growth of electricity demand in the U.S., which has been driven primarily by the…

10.05.2026
For investors, the spookiest thing about October might not be the ghosts and monsters that are bound to show up…

09.28.2026
The phrase “expectations of higher inflation” has become a staple in financial news to explain the increase in nominal U.S….
09.21.2026
For much of the past several years, the conventional view has been that higher interest rates and stretched valuations would…
09.14.2026
There are many great things about working at Marquette Associates, but “Free Lunch Tuesday” is right at the top of…
Research alerts keep you updated on our latest research publications. Simply enter your contact information, choose the research alerts you would like to receive and click Subscribe. Alerts will be sent as research is published.
We respect your privacy. We will never share or sell your information.
If you have questions or need further information, please contact us directly and we will respond to your inquiry within 24 hours.
Contact Us >