10.19.2026
Divided We Rise?
Since 1980, the S&P 500 Index has generally performed well in the weeks surrounding U.S. midterm elections. Specifically, the index…


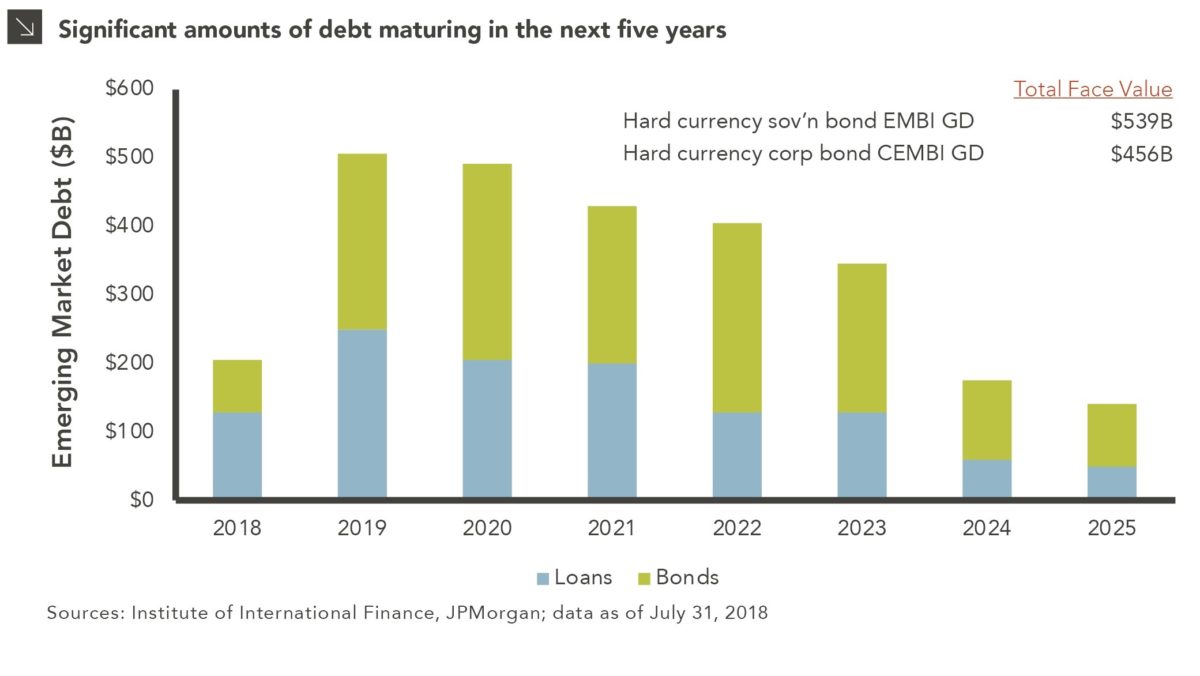
This week’s chart looks at the looming maturity wall for emerging markets debt. The chart shows the amounts coming due for U.S. dollar-denominated emerging markets debt issued by both sovereigns and corporates. The green portion represents publicly traded bonds, while the blue portion represents bank loans.
The table in the top right shows that the total face value of hard currency sovereign bond debt, as represented by the JPMorgan EMBI Global Diversified index, is $539 billion. The total face value of hard currency corporate bond debt, as represented by the JPMorgan CEMBI Broad Diversified index, is $456 billion. “Hard currency” is generally defined as U.S. dollar-denominated.
The 2018 bar represents the amounts maturing for the rest of 2018, a relatively small amount. However, the amounts maturing in the next five years are substantial. As the dollar continues to strengthen relative to emerging market currencies due to the Federal Reserve’s rate hikes, emerging market issuers may find it more difficult to pay the interest and principal — or even refinance their debt. This is because they earn their tax revenue in local currencies but must pay interest and principal in dollars. The trade weighted U.S. dollar broad index, an index of the U.S. dollar versus a basket of foreign currencies, rose 6.9% so far in 2018 and has risen 31.9% since 2011.
We continue to recommend emerging markets debt as a long term strategic asset class, because fundamentals in terms of GDP growth, debt-to-GDP leverage and current account balances are stronger than five, ten and twenty years ago. However, developed central banks such as the Federal Reserve, Europrean Central Bank and Bank of Japan are converging and will eventually tighten together, thereby raising their rates and strengthening their currencies — relative to emerging market rates and currencies. Thus despite the long-term merits of the asset class, given the looming maturity wall and tightening by the world’s major central banks, it will not be surprising to see elevated volatility from EMD in the short-term.
The opinions expressed herein are those of Marquette Associates, Inc. (“Marquette”), and are subject to change without notice. This material is not financial advice or an offer to purchase or sell any product. Marquette reserves the right to modify its current investment strategies and techniques based on changing market dynamics or client needs.
The opinions expressed herein are those of Marquette Associates, Inc. (“Marquette”), and are subject to change without notice. This material is not financial advice or an offer to purchase or sell any product. Marquette reserves the right to modify its current investment strategies and techniques based on changing market dynamics or client needs.

10.19.2026
Since 1980, the S&P 500 Index has generally performed well in the weeks surrounding U.S. midterm elections. Specifically, the index…

10.12.2026
This week’s chart highlights the accelerating growth of electricity demand in the U.S., which has been driven primarily by the…

10.05.2026
For investors, the spookiest thing about October might not be the ghosts and monsters that are bound to show up…

09.28.2026
The phrase “expectations of higher inflation” has become a staple in financial news to explain the increase in nominal U.S….

09.21.2026
For much of the past several years, the conventional view has been that higher interest rates and stretched valuations would…

09.14.2026
There are many great things about working at Marquette Associates, but “Free Lunch Tuesday” is right at the top of…
Research alerts keep you updated on our latest research publications. Simply enter your contact information, choose the research alerts you would like to receive and click Subscribe. Alerts will be sent as research is published.
We respect your privacy. We will never share or sell your information.
If you have questions or need further information, please contact us directly and we will respond to your inquiry within 24 hours.
Contact Us >