10.19.2026
Divided We Rise?
Since 1980, the S&P 500 Index has generally performed well in the weeks surrounding U.S. midterm elections. Specifically, the index…


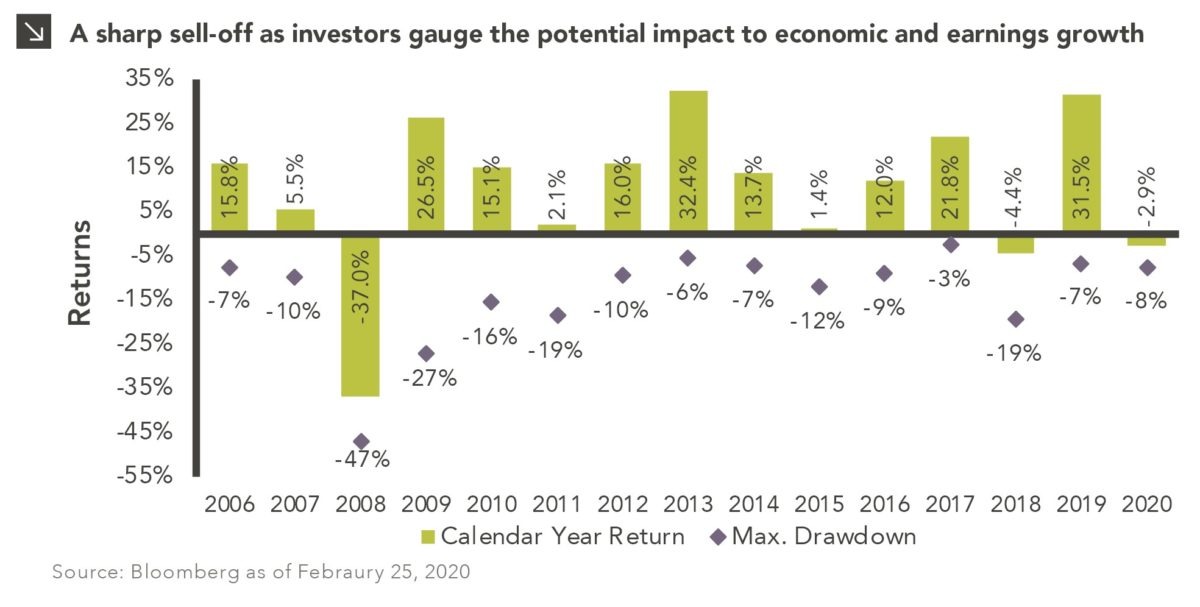
U.S. equities recently experienced a sharp three-day sell-off as the market digested the potential for short-term disruptions to economic growth and company earnings due to the Coronavirus (COVID-19). With new health figures coming out daily, it is easy to become alarmed. However, as our Chart of the Week from February 13th highlighted, prior health crises have been proven to be non-events longer-term for equity markets. Similar outbreaks in the past caused short-term sell-offs in equity markets but longer-term saw positive market performance.
This week’s chart shows calendar year returns for the S&P 500 along with the max drawdown that occurred in each respective year. As of February 25, 2020, the S&P 500 has recorded a year-to-date drawdown of 7.6%. The current pullback is undeniably sharp in nature, but it is important to maintain perspective during turbulent times. Over the past 15 years, the average annual max drawdown was 14%. Many years experienced drawdowns near this level, yet still yielded a positive return for the year. On average, equities see a 5% pullback four times per year, a 10% pullback once per year, and a 20% correction once every five years.
While no one knows the full impact that the current outbreak will have to supply chains, trade, or travel, we recommend taking a long-term view to investing. The market had been looking past this current health crisis until the last few days, so a repricing of risk was inevitable. As this is an evolving situation, there is risk that the economic impact could increase and add further pressure to equities. However, the current pullback remains in-line with historical trends.
Print PDF > Coronavirus Roils the Equity Markets
The opinions expressed herein are those of Marquette Associates, Inc. (“Marquette”), and are subject to change without notice. This material is not financial advice or an offer to purchase or sell any product. Marquette reserves the right to modify its current investment strategies and techniques based on changing market dynamics or client needs.

10.19.2026
Since 1980, the S&P 500 Index has generally performed well in the weeks surrounding U.S. midterm elections. Specifically, the index…

10.12.2026
This week’s chart highlights the accelerating growth of electricity demand in the U.S., which has been driven primarily by the…

10.08.2026
LIVE WEBINAR — OCTOBER 22 Please join Marquette’s research team for our 3Q 2026 Market Insights Webinar…

10.05.2026
For investors, the spookiest thing about October might not be the ghosts and monsters that are bound to show up…

09.28.2026
The phrase “expectations of higher inflation” has become a staple in financial news to explain the increase in nominal U.S….

09.21.2026
For much of the past several years, the conventional view has been that higher interest rates and stretched valuations would…
Research alerts keep you updated on our latest research publications. Simply enter your contact information, choose the research alerts you would like to receive and click Subscribe. Alerts will be sent as research is published.
We respect your privacy. We will never share or sell your information.
If you have questions or need further information, please contact us directly and we will respond to your inquiry within 24 hours.
Contact Us >