1Q 2026 Market Insights Webinar

This video is a recording of a live webinar held April 16 by Marquette’s research team analyzing the first quarter across the economy and various asset classes as well as themes we’ll be monitoring in the coming months.

Our quarterly Market Insights series examines the primary asset classes we cover for clients including the U.S. economy, fixed income, U.S. and non-U.S. equities, hedge funds, real assets, and private markets, with commentary by our research analysts and directors.

Featuring:
Greg Leonberger, FSA, EA, MAAA, FCA, Partner, Director of Research
James Torgerson, Senior Research Analyst
Fred Huang, Research Analyst
David Hernandez, CFA, Director of Traditional Manager Search
Evan Frazier, CFA, CAIA, Senior Research Analyst
Dennis Yu, Research Analyst
Hayley McCollum, Senior Research Analyst

Sign up for research alerts to be invited to future webinars and notified when we publish new videos.

If you have any questions, please send our team an email.


Brains Over Brawn?

The development of artificial intelligence is advancing along two largely distinct paths. The first centers on generative AI powered by large language models, with the long-term objective of creating systems that can reason across domains at levels superior to those of human beings. The second focuses on embodied intelligence (i.e., robotics). In this space, the objective is not abstract reasoning but rather the deployment of capable machines that can operate effectively in the physical world. Over the last five years, capital and attention have overwhelmingly gravitated toward companies involved in generative AI, with the Bloomberg Artificial Intelligence Index up a staggering 276% in that time. Robotics, by comparison, has been widely viewed as a longer-dated theme, with the Bloomberg Robotics Index up only 77% over that same period (even less than the S&P 500 Index return of 134%). These dynamics can be observed in this week’s chart.

Going forward, there are reasons to believe that this performance trend may shift in the years ahead. For instance, human-level general intelligence could be far more distant than markets currently assume, and language models may not prove sufficient to reach it. At the same time, practical robots (e.g., warehouse automation, humanoid assistants, etc.) appear closer to commercial reality than previously believed, particularly in aging societies facing persistent labor shortages. One possible accelerant for robotics companies in the years ahead is the use of advanced simulation. By training in virtual environments, robots can acquire motor skills and coordination far more rapidly than through physical trial and error alone, potentially pulling forward adoption timelines relative to current investor expectations. Importantly, transformative impact does not require robots to achieve artificial general intelligence but rather functional capability (i.e., the ability to move objects, operate safely, and sustain useful work with sufficient battery life). Commercial momentum in robotics is already building. In 2024, for example, Agility Robotics opened a manufacturing facility in Oregon with capacity to produce up to 10,000 humanoid units annually, and Amazon has now begun testing Agility’s robots in its warehouses. Additionally, companies like Tesla are showcasing humanoid prototypes performing increasingly fluid physical tasks, and BYD has signaled interest in future household robotics. While price points remain prohibitive for mass adoption today, several structural forces are converging to improve the economics of robotics. Manufacturing costs are declining as scaling drives down prices for components like sensors and actuators, while improvements in AI models are enhancing robotic perception and control. Taken in tandem with the fact that generative AI leaders are currently investing heavily in costly, power-hungry data centers, it is fair to say that a once slower-moving, less glamorous segment of the AI ecosystem may now benefit from relative capital efficiency.

Despite these developments, markets continue to assign a significant valuation premium to generative AI over robotics, which can also be observed in the chart above. Factor analysis helps explain part of the gap, as AI-heavy indexes skew toward momentum and growth while robotics-oriented benchmarks exhibit greater exposure to value, quality, and, in some cases, even dividend income. Further, the generative AI complex is dominated by large technology platforms including Alphabet, Microsoft, and NVIDIA, whereas robotics companies tend to be more industrial in nature (e.g., automation specialists, automakers, and emerging consumer-robotics firms). This valuation disconnect suggests that investors may be overemphasizing long-term breakthroughs in cognition while underappreciating near-term progress in physical automation, especially as physical robots transition from research environments into factories, homes, and hospitals. Indeed, while much of today’s excitement centers on artificial brains, it may ultimately be robotic brawn that drives the next leg of growth within the technology sector.

Big “Issues” for Big Tech

While technology-oriented firms have made their presence known in equity markets for several years, these companies have made waves in the fixed income space recently as well. Companies such as Alphabet, Meta, and Oracle, which in the past have funded initiatives via balance sheet cash, have increasingly turned to the bond market to finance the buildout of AI-related infrastructure. Specifically, a total of nearly $240 billion worth of investment-grade bonds have been sold by technology giants on a year-to-date basis through the end of November. Some notable deals in 2025 include Meta’s $30 billion bond sale, the largest in the U.S. high-grade market this year, Oracle’s $18 billion issuance in September, and Alphabet’s deal that raised $17.5 billion in the U.S. and another €6.5 billion (roughly $7.5 billion) in Europe.

This surge in supply carries meaningful implications for the broader investment-grade corporate market, which is one of the most heavily traded areas of fixed income. For instance, the sheer volume of new issuance from technology companies can put upward pressure on corporate spreads as investors demand slightly higher yields (despite the strong balance sheets and generally low leverage of these firms). There is also the question of the potential return on AI-related spending (or lack thereof). Indeed, a recent MIT study found that around 95% of companies have yet to see any meaningful payoff from their generative AI efforts. At the same time, investors and creditors are growing more cautious, increasing their use of derivatives designed to pay out if specific technology firms fail to meet their debt obligations. That said, investment in AI-related infrastructure seems likely to continue at full speed in the years ahead, meaning technology firms may continue to tap the investment-grade market for financing.

Small Caps: Unprofitables Lead, Active Managers Lag, But Can it Last?

At the start of 2025, very few could have predicted the wild ride that awaited equity markets. After a volatile period that culminated on April 8, U.S. equities achieved several new all-time highs, with small-cap equities reaching a first all-time high since November 2021. Absolute returns have been substantial, as the Russell 2000 rose nearly 42% off the market bottom through October 31. Despite renewed volatility in November as expectations for another Federal Reserve rate cut fluctuated, small-cap equities have led large-cap equities since April 8. As is expected in the first six months of a bull market, low quality, including residual volatility, short interest, non-earners, and beta, propelled the small-cap market. Conversely, active managers favor high quality companies, typically characterized by high returns on equity, strong balance sheets, and low leverage. As a result, this factor backdrop is a known headwind for many active managers across the small-cap universe, and this bull market is no different.

The Asymmetry of Unemployment

A fundamental characteristic of U.S. labor markets is the pronounced asymmetry in unemployment dynamics, as joblessness rises anywhere from three to five times faster during recessions than it falls during recoveries. This “sawblade” pattern has important implications for economic forecasting, monetary policy, and investment portfolio positioning. Amid recessionary conditions in the early 1980s, unemployment surged from 7.0% to 10.8% in just 16 months (an average increase of more than 0.2% per month). The subsequent recovery took 54 months, with unemployment declining at a rate of less than 0.1% each month on average. The Global Financial Crisis of 2008 exemplifies this pattern even more dramatically, as unemployment jumped from 5.0% to 10.0% in 22 months and normalized over a period of more than six years, during which time millions of workers faced extended joblessness. Most striking was the COVID-19 pandemic of 2020, when unemployment exploded from 3.5% to 14.7% in just two months (the sharpest spike in modern American history). While the initial recovery was faster than historical norms due to unprecedented fiscal and monetary stimulus, the unemployment rate still took 33 months to return to pre-pandemic levels. This illustrates that even with extraordinary policy support, labor market normalization remains gradual. The pattern described above reflects fundamental labor market frictions. On one hand, companies can execute mass layoffs within weeks when facing existential threats or demand shocks. At the same time, hiring is usually carried out with caution, as firms slowly restaff as confidence improves, workers require time to locate appropriate positions, and many require retraining for structural shifts in demand. Indeed, this friction is not a policy bug but rather a feature of how the labor market functions.

Understanding unemployment asymmetry is critical for investors today as the Federal Reserve navigates an increasingly complex challenge related to its dual mandate of stable prices and maximum employment. Specifically, the Fed faces an unprecedented data vacuum due to the recent government shutdown, and traditional labor market indicators are sending mixed signals. For instance, payroll growth has moderated but remains positive, initial jobless claims are elevated but have not reached recessionary levels, and the unemployment rate has risen yet remains relatively low. Some have also linked the rise of artificial intelligence to recent hiring trends, though it remains unclear whether these trends represent a meaningful secular shift in labor demand. Complications are intensified by inflation that remains stubbornly above the Fed’s 2% target. In short, looser monetary policy could lead to even higher price levels, while restrictive policy could trigger higher unemployment if actual labor market conditions are worse than available data points suggest.

Going forward, the Fed will likely be forced to prioritize one side of its dual mandate over the other, as interest rate policy is too blunt an instrument to fine-tune both price and employment levels simultaneously. The current environment represents precisely the knife-edge scenario in which an understanding of asymmetric labor dynamics becomes essential for economic forecasting.

The Impact of Artificial Intelligence on Markets

Over the last several decades, artificial intelligence (“AI”) has evolved from a theoretical concept into a transformative force across a variety of industries. The 1940s saw the advent of the digital computer, which was followed years later by the first artificial neural network, a computational model inspired by the structure of the human brain that consists of algorithms that attempt to recognize relationships in data. In more recent years, researchers have developed “deep learning” systems (i.e., neural networks with many layers) capable of increasingly complex tasks including image recognition, reading comprehension, and predictive reasoning. Given the advances in the space, it should not come as a surprise that the use cases of artificial intelligence are now vast, with AI tools now implemented across fields including health care, retail, finance, and entertainment. Researchers and corporate executives are not the only ones to have noticed the remarkable potential of AI, however, as investors have flocked to the space in droves over the last several years.

This newsletter outlines the growth of AI as an investment theme, including performance, valuations, and earnings growth of AI-related companies and equities, other segments of the market that may stand to benefit from advances in AI, and potential risks for investors.

Back to Back!

This week’s chart details each calendar year return for the S&P 500 Index dating back to 1928, with consecutive 20%+ returns highlighted in orange. Despite a slight pullback over the last few weeks, the index posted a return of more than 20% in 2024, which represents only the fifth time in history that the benchmark has recorded such a figure in consecutive years (note that the five straight years of 20%+ returns in the 1990s are counted as one instance). As investors look ahead to 2025 and beyond, many are asking the following question: How have markets performed after such strong periods?

In the years following the first three of these instances (1937, 1956, and 1984), the S&P 500 Index notched a significantly lower return, with an average of -1.1%. Interestingly, each of these years was marked by either tighter monetary policy, inflation, decreased industrial production, higher unemployment, or some combination of these trends. As mentioned above, the late 1990s saw a staggering five consecutive years of 20%+ returns for the S&P 500 Index, fueled by a boom in investor interest in e-commerce, software, and telecommunications companies. The so-called “Dot-Com Bubble” led to widespread speculation related to unprofitable companies and a rapid expansion in market valuations, and the bursting of this bubble caused the S&P 500 Index to decline sharply in the first three years of the new millennium.

In the last two years, performance of the S&P 500 index has been largely driven by investor interest in artificial intelligence and the Information Technology sector. The Magnificent Seven stocks (Apple, Microsoft, Amazon, Alphabet, NVIDIA, Meta, and Tesla) have led the charge, accounting for over 50% of the total return for the benchmark since the beginning of 2023. As artificial intelligence becomes increasingly integrated into the global economy, these and other similar companies are expected to attract more investment and drive additional index returns. While there are some similarities between the current environment and the Dot-Com Bubble, the U.S. economy continues to show resilience and most of the winners from the last two years are well-established businesses with healthy profits. Still, history has shown us that periods of robust equity market performance do not continue forever. As the calendar changes to 2025, investors should keep this idea in mind as it relates to expectations for near-term stock returns.

Volatility Pops as Equities Drop

Recent days have proved quite challenging for equity investors. On the international front, the Nikkei 225 — which tracks the performance of large, public companies in Japan — dropped by more than 12% in Monday’s trading session. This figure represents the most significant single-day drawdown for that index in more than 35 years. Other non-U.S. equity benchmarks have exhibited similar pullbacks: The MSCI EAFE and MSCI EM indices are both down roughly 6% on a month-to-date basis as of the time of this writing. Performance has been similarly challenged for domestic stocks, with the S&P 500 and Russell 2000 indices down around 6% and 10%, respectively, over that same period. Perhaps unsurprisingly, the CBOE Volatility Index (“VIX”) reached a level not seen in more than four years during Monday’s trading session as investors grappled with broad market turbulence. Despite some moderation throughout the Monday session, the VIX remains well above its 10-year average after a prolonged period of muted volatility. These dynamics can be observed in the chart above.

As is often the case during market downturns, there is not a single force driving recent performance but rather a variety of factors at play. Some of the factors in this case include the following:

  • Friday’s lackluster jobs report, which detailed a higher U.S. unemployment rate (4.3% in July vs. 4.1% in June) and monthly nonfarm payroll gains for the last month that came in well below expectations (114,000 realized vs. 185,000 estimated). These and other souring economic data points may be leading investors to question the extent to which a soft economic landing can truly be achieved in the months ahead.
  • Waning enthusiasm surrounding the artificial intelligence trade, which has led to historically high concentration risk within many indices. Price drops of many large index constituents, many of which have benefitted from AI-related fervor, have exacerbated pressures on U.S. equity benchmarks in particular.
  • Technical factors, particularly related to a popular carry trade featuring the Japanese yen. A stronger yen and an unwinding of global yen carry trades, wherein investors borrowed in the low-yielding currency and reinvested the proceeds elsewhere, have created a negative feedback loop that has led to equity price pressures.

The dynamics described above have further clouded the future. As recently as last month, market participants expected roughly two rate cuts from the Federal Reserve for the remainder of 2024; now that figure sits at around five, with two 25 basis point cuts forecasted at the next FOMC meeting in September. To that point, the yield on the 2-Year Treasury, which closely tracks expectations surrounding Fed policy, briefly sank below 3.7% on Monday before pulling back to around 3.9% later in the trading session.

It is important to remember that the current market decline is not unprecedented. Investors should recall that equity indices are prone to corrections, with the S&P 500 Index exhibiting a drawdown of 10% or greater in 19 of the last 30 calendar years. As always, we encourage investors to maintain a long-term outlook related to their portfolios and not overreact to short-term volatility. A disciplined portfolio rebalancing policy coupled with a long-term strategic asset allocation is the most proven method to achieve risk and return objectives.

Semi-Charmed Country

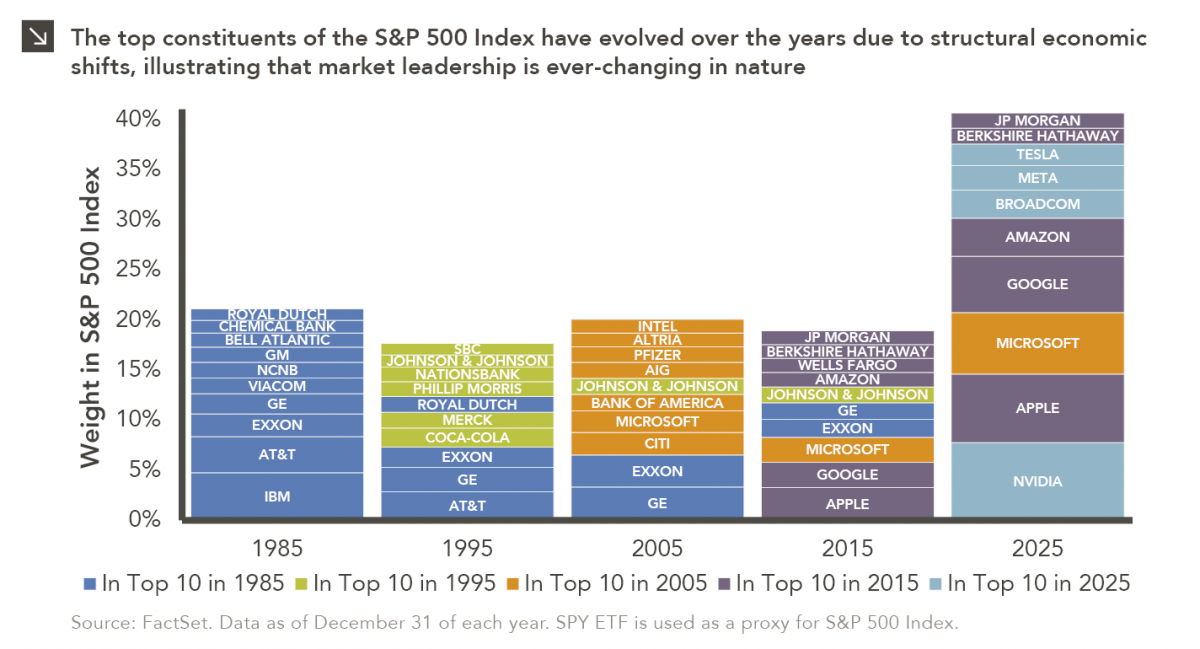
Index concentration has been top of mind for investors in recent time, as fervor surrounding advances in artificial intelligence has led to outsized weights of a handful of constituents (e.g., Microsoft, NVIDIA, etc.) within domestic equity benchmarks like the S&P 500 Index. It is important to note, however, that index concentration is not simply a domestic phenomenon. For example, the Taiwanese equity market is notably exposed to technology-oriented companies, as roughly 80% of the MSCI Taiwan Index is comprised of Information Technology positions. Moreover, the index is heavily tilted toward one company in particular: Taiwan Semiconductor Manufacturing Company (TSMC). TSMC comprises just over 50% of the benchmark and has generated a year-to-date return of roughly 55% through the end of June. As it relates to these dynamics, readers may call to mind two questions: First, how did technology (and semiconductor manufacturing, in particular) come to play such an integral role within the Taiwanese economy? And second, to what extent are global semiconductor supply chains reliant on Taiwan?

TSMC was founded in 1987, with capital provided by the Taiwanese government in hopes of starting a new national industry. At that time, the company decided to focus solely on semiconductor production, which meant creating fabrication plants to manufacture chips for other businesses. This innovative model, commonly known as the foundry model, allowed TSMC to work with semiconductor companies that designed their own chips as opposed to competing against them. It is evident now that this model was hugely successful, as the current revenue share of TSMC accounts for more than 60% of the global semiconductor foundry market. The total market share of Taiwan reaches 70% when one includes other Taiwanese foundry companies (e.g., UMC, PSCM, and VIS). Factors that have led to the country’s strong success in this market include the aforementioned creation of the foundry model, as well as the highly efficient nature of Taiwanese semiconductor companies and the fact that employees in Taiwan’s semiconductor workforce are compensated well relative to those employed in other industries.

Taiwan is clearly the dominant participant in the foundry market, but it is important to note that the production of semiconductors depends on multiple players, including “fabless” chip designers (e.g., NVIDIA), companies that test and package chips, and end manufacturers. This means that the semiconductor supply chain extends well beyond Taiwan, although the country’s role within that chain is clearly crucial, as evidenced by the global chip shortage during the COVID-19 pandemic. In the wake of that shortage, and with continued geopolitical concerns surrounding China and Taiwan, countries around the world have aimed to de-risk supply chains and, therefore, have made significant investments in their domestic semiconductor industries. To that point, many European countries, as well as China, Japan, and the United States, have all committed significant resources to this endeavor. With increasingly complex artificial intelligence requiring more sophisticated chips, the semiconductor space still appears to present compelling investment opportunities, both within Taiwan and throughout the rest of the world.

How to Appraise the AI Craze

Even the most casual observers of market dynamics are likely aware that investor interest in artificial intelligence (AI) has surged in recent time. Within public equity markets, the share prices of companies tied to AI like Meta, Microsoft, and Nvidia have seen massive rallies since the start of the year, and a similar story exists in the world of venture capital. On a year-to-date basis through June 30, 2023, which is the most recent date for which information is available, companies focused on AI-related initiatives received 26% of total U.S. venture funding according to Crunchbase. This number represents a significant increase from the 11% figure posted in 2022. According to Pitchbook, a total of $23.2 billion has been committed to generative AI start-up businesses in 2023 through mid-October, which is already an increase of 250% when compared to last year’s total.

There are several factors that help to explain this surge in investor interest. First, recent advances in the field of generative AI have allowed for the automation of creative processes that have applicability across the market spectrum. To that point, a recent survey conducted by Boston Consulting Group found that roughly 70% of marketing companies are already employing generative AI processes for a variety of use cases including content creation and the personalization of advertising. Additionally, the field of adaptive AI, which includes machine learning, has also seen progress in recent time, with many companies now using these tools in forecasting and data analysis. Indeed, whether these new technologies are utilized to increase efficiency or decrease costs, it is clear that businesses across the economy find the benefits of AI extremely appealing, as do many investors.

Given the significant capital flows into the AI space this year, readers may be questioning the extent to which the current landscape mirrors that of the Dot-Com Bubble of the late 1990s. While it is likely too early to answer that question, it is clear that not all AI-related companies will succeed in the long run, and investors with excessive exposures to the space may be taking on elevated risk levels given a lack of diversification. At the same time, the use cases of AI are clearly significant and broad, so market participants will certainly benefit from some level of exposure to the space across both public and private markets. This dynamic speaks to the importance of investment manager due diligence and selection, which Marquette conducts on an ongoing basis across the asset class spectrum.