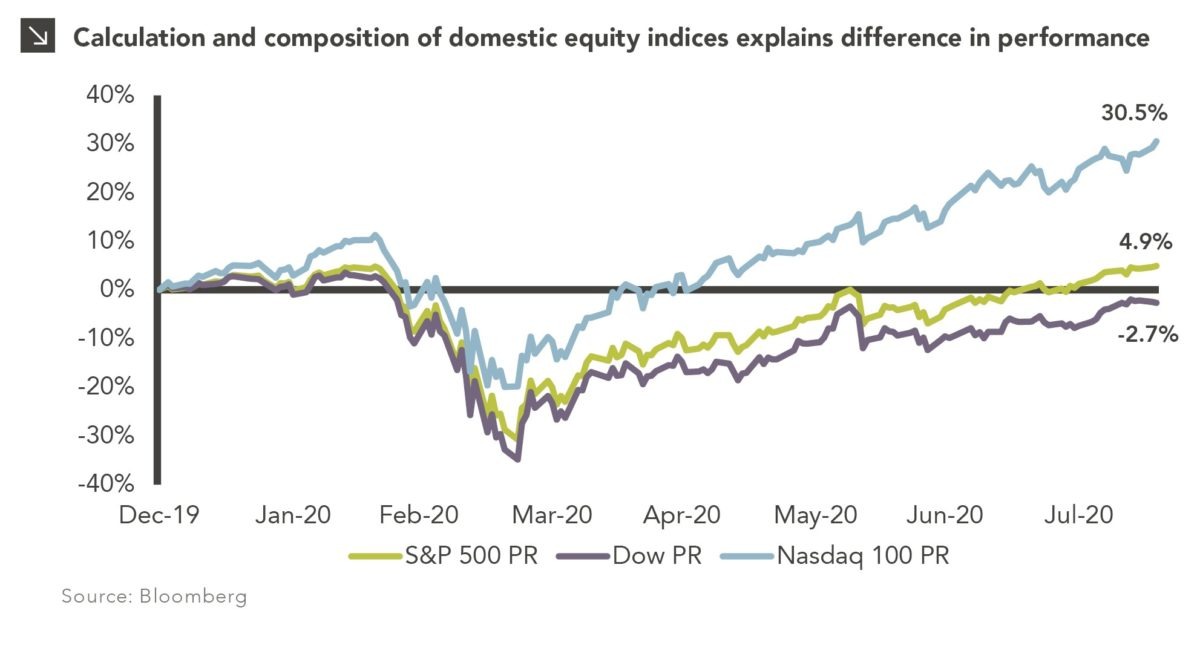
Second Quarter Review of Asset Allocation: Risks and Opportunities

The second quarter of 2020 proved to be as eventful as the first, with slow economic results being largely ignored as markets rallied. GDP growth for the quarter is expected to come in at -35.5% YoY, though 3Q GDP projections indicate a significant rebound is expected as the country begins to reopen to “the new normal.” In addition, the unemployment rate came in at 11.1%, down from the April peak above 14%. Below are some highlights from the quarter:

  • Countries around the globe began reopening businesses amid fears of a second wave of COVID-19 infections.
  • Daily infections reached a new high in the United States at more than 50,000 per day, causing some states to roll back their reopening plans.
  • Weekly initial claims for unemployment insurance have continued to trend downwards.
  • Additional fiscal and monetary stimulus are expected in the second half of the year, bolstering markets.

COVID-19 has proven to be a potentially long-lasting concern as it remains to be seen whether we are in for a V-shaped or U-shaped recovery. Economic data is improving slowly, though markets have seemed to shrug off some of the negative news as the S&P 500 moved into positive territory over the one-year period. Though it may have fallen into the background due to COVID-19, 2020 is a presidential election year. Uncertainty surrounding the election will undoubtedly have an impact on forward-looking expectations. In this newsletter, we analyze what all of this means for each asset class.

Read > Second Quarter Review of Asset Allocation: Risks and Opportunities


The opinions expressed herein are those of Marquette Associates, Inc. (“Marquette”), and are subject to change without notice. This material is not financial advice or an offer to purchase or sell any product. Marquette reserves the right to modify its current investment strategies and techniques based on changing market dynamics or client needs.

Best Historical Performing Asset Class Is on Sale!

It is critical for institutional investors to understand the importance of both relative and absolute value when considering investment allocations. From a relative value perspective, private equity ­— which has been one of the most desired and consistently best performing asset classes over the last 20 years — is now on sale.

Following global investment volatility and panic from the COVID-19 crisis in March, the combination of government intervention along with public equity enthusiasm has driven public valuation multiples to near-record levels over the last three months with the Russell 3000 trading at 15x EV/EBITDA (S&P 500 at 23x EV/EBITDA), making the relative value trade even more compelling for private equity investments. Meanwhile, private equity multiples have been more stable, with May transactions occurring at 10x for middle market buyouts and 7.5x for small buyouts less than $100 million in enterprise value, providing investors a 35% or 50% relative discount respectively as compared to the Russell 3000. The current valuation spread provides the widest spread these markets have offered.

Private equity managers have mostly shown investment discipline, thinking longer-term and focused on absolute returns over a multi-year basis, which has resulted in a tighter range of valuations paid as compared to rising public equity multiples over the last decade. However, given the current market dynamics with the valuation spread growing, it is likely private market investors will benefit from the relative outperformance of private equity capital deployed in 2020.

This may be an opportune time for institutional investors to consider stepping back from elevated public market valuations and find ways to allocate more capital and raise their targeted allocations to private equity in order to maximize the absolute returns of their portfolios. We have seen clients increasing their annual deployment and focusing on more opportunistic strategies, including co-investment funds and secondary funds which have shorter investment periods thus allowing more capital to be deployed in 2020 and 2021.

Furthermore, private equity managers should increasingly be thinking about the relative value of the capital that has been committed to them. The last few years have provided for record-breaking fundraising for the private equity industry. This committed capital is currently sitting in dry powder and in most cases remains uncalled from investors sitting in public equity markets. Due to the current valuation spread, the relative value these private equity managers provide by finding opportunities present in the private market is great. Most importantly, more capital being put to work in private markets can expand the number of private equity-owned businesses and does not have to drive up the valuations paid, unlike in public markets where there are a fixed number of opportunities and where more capital being deployed in public equities pushes valuations higher.

Print PDF > Best Historical Performing Asset Class Is on Sale!


The opinions expressed herein are those of Marquette Associates, Inc. (“Marquette”), and are subject to change without notice. This material is not financial advice or an offer to purchase or sell any product. Marquette reserves the right to modify its current investment strategies and techniques based on changing market dynamics or client needs.

Russell Rebalance: What Happened?

Summer has arrived and with it comes the annual “Russell Rebalance,” or as FTSE Russell — the index administrator — officially calls it, the Russell Reconstitution. The last Friday in June brings a unique set of challenges for investors managing to one of Russell’s many indices. More than half of U.S. equity investment managers benchmark to a FTSE Russell Index and the Russell rebalance affects an estimated $9 trillion across these products.¹ The entire family of Russell U.S. indices is recast to reflect changes in the U.S. equity markets over the preceding year. Essentially, the rebalance resets market cap weightings and style designations, which ultimately drive shifts in the underlying sector distributions. This creates one of the highest trade-volume days of the year.

The market’s appreciation over the longest bull market in history pushed the market cap breakpoint between the asset classes to a peak in 2018 of $3.7 billion. As a result, the market cap threshold for constituents to be placed into either the large- and mid-cap focused Russell 1000 Index or the small-cap focused Russell 2000 Index has grown 150% since the Great Financial Crisis.

This past Friday, June 26th, marked the official reconstitution day. Notable movements in this year’s rebalance revolved around a few key sectors: Financials, Health Care, Industrials, and Information Technology. The Russell 1000 saw little movement in sector allocation, while the respective style indices, the Russell 1000 Growth and Value benchmarks, experienced the brunt of change. Technology now comprises a record 43% of the Russell 1000 Growth Index, a 2.3% rise, while the Industrials allocation fell to 4.6%, from 7.3%. The Russell 1000 Value Index was the recipient of those Industrials companies, rising from 9.6% to 12.4%.

From a market cap perspective, many banks within the Russell 1000 Financials sector moved to the small-cap index as investors sold economically sensitive stocks in the first quarter of the year. The Russell 2000 Index saw a 1.6% increase to the sector, bringing the total weight in Financials to 16.2%. As expected, many of these banks qualified for the Russell 2000 Value Index, which now has a nearly 29% weight to the sector. Likely the largest hurdle for active managers navigating the rebalance is the increased allocation to Biotechnology, an industry within the Health Care sector. These securities, many of which do not make money and have no established products, go against the investment philosophies of many fundamentally driven active managers. The Russell 2000 Growth Index now has a more than an 18% allocation to the industry. As managers settle into their new benchmarks, it will be pertinent to discuss these sectoral and capitalization changes in the context of future performance expectations.

Print PDF > Russell Rebalance: What Happened?

¹ FTSE Russell


The opinions expressed herein are those of Marquette Associates, Inc. (“Marquette”), and are subject to change without notice. This material is not financial advice or an offer to purchase or sell any product. Marquette reserves the right to modify its current investment strategies and techniques based on changing market dynamics or client needs.

Sustainable Investing in a Post-COVID World

Defined as an unpredictable occurrence that is beyond the scope of normal expectations, a black swan event is rare and has potentially severe consequences. Even as COVID-19 spread across the globe in late March, the level of disruption ultimately caused by the virus came as a surprise to most. The global pandemic that followed suit was certainly a black swan event with some economists dubbing it the first sustainability crisis of the 21st century.

From a market perspective, stocks experienced the sharpest sell-off in history; while no sector was left unscathed, some relative winners and losers were identified. Of note was the outperformance of sustainable investing strategies compared to their non-sustainable counterparts. The purpose of this newsletter is to dive deeper into the performance of sustainable investing strategies during the past several months and attempt to provide insight into what investors, investment managers, and companies will be seeking from a sustainability perspective in a post-COVID world.

Read > Sustainable Investing in a Post-COVID World


The opinions expressed herein are those of Marquette Associates, Inc. (“Marquette”), and are subject to change without notice. This material is not financial advice or an offer to purchase or sell any product. Marquette reserves the right to modify its current investment strategies and techniques based on changing market dynamics or client needs.

The Stock Market vs. Trump

Though it has so far taken somewhat of a backseat to the COVID-19 pandemic and global protests for racial justice, 2020 is a U.S. presidential election year. As can be seen in the chart, over the last year and the last several months in particular, the S&P 500 has generally moved in line with expectations for Trump’s reelection this November.¹ As the complicated debate over whether the stock market performs better under a Republican or Democratic president continues, the historical numbers show that the market does notably better in an election year when a Republican wins the seat. While there are always many moving pieces, this makes sense, as Republicans are often considered more pro-business and pro-market than Democrats.

Now into June, that correlation has completely reversed. The S&P 500 has continued its recovery, getting back to flat on the year before last Thursday’s correction, while chances of a 2020 Republican victory have hit new lows. Though based on only two weeks of data — and with another almost five months until the election — it is an interesting departure from historical trends. Voters certainly have a lot to grapple with over the next several months and we will continue to follow all developments closely as history is made.

Print PDF > The Stock Market vs. Trump

¹As measured by data from political betting site PredictIt: “Which party will win the 2020 U.S. presidential election?”


The opinions expressed herein are those of Marquette Associates, Inc. (“Marquette”), and are subject to change without notice. This material is not financial advice or an offer to purchase or sell any product. Marquette reserves the right to modify its current investment strategies and techniques based on changing market dynamics or client needs.

The Impact of COVID-19 on Not-for-Profit Healthcare Systems

The onset of the global pandemic caused by COVID-19 has created substantial stress in the financial markets and the broader economy. Unlike the Global Financial Crisis (“GFC”), the current pandemic is a health care crisis that has had a much more direct and swift effect on all of our hospital clients’ operations and financial positions. The following newsletter represents Marquette’s key observations regarding the current operating environment for the not-for-profit (“NFP”) hospital sector, as well as an outlook for the remainder of 2020.

Read > The Impact of COVID-19 on Not-for-Profit Healthcare Systems


The opinions expressed herein are those of Marquette Associates, Inc. (“Marquette”), and are subject to change without notice. This material is not financial advice or an offer to purchase or sell any product. Marquette reserves the right to modify its current investment strategies and techniques based on changing market dynamics or client needs.

Is the Worst Behind Us?

The 10-year Treasury yield broke through a key threshold yesterday closing at 0.77%, its highest in eight weeks, and ending at the same 0.77% that it closed at on April 8th. As shown in this week’s chart, the yield curve has been steepening substantially since March 9th, when the 10-year closed at its all-time low of 0.54%. This steepening may be a sign from the bond markets that the worst might be behind us.

On the economic front, Automatic Data Processing released data yesterday that showed the private sector lost only 2.76 million jobs in May, far below the 8.75 million forecasted by economists, and also far below the 19.56 million private sector jobs that were lost in April. This welcome news was amplified by National Institute for Allergy and Infectious Diseases Director Dr. Anthony Fauci’s remark that Moderna’s COVID-19 vaccine candidate is likely on-track to start Phase III human trials in July. Additionally, he noted that the plan is to begin manufacturing doses of the vaccine in tandem with the trials so that potentially 100 million doses are available to be shipped by November or December. Collectively, these favorable developments sent the S&P 500 up 1.36% and the 10-year Treasury yield from 0.68% to 0.77% yesterday, steepening the yield curve. As such, the fixed income and equity markets are finally exhibiting normal correlations, as a steepening curve with a rallying stock market signifies investors selling down long-dated Treasury bonds to buy stocks. This is in contrast with the March cash dash that sent rates down while the curve steepened all the while the stock markets fell as investors sold off both stocks and bonds to raise cash.

Also shown in our chart are the projected Treasury yield curves for the end of this year and the next two years based on the Treasury forwards market. They show the yield curve continuing to rise and steepen, with the 10-year forecasted to rise to 0.85% at the end of this year, 1.02% at the end of next year, and 1.18% at the end of 2022. While Treasury forwards will continue to fluctuate and the 10-year cannot be expected to reach these projected yields exactly, the expected steepening shows that the bond markets are expressing some level of optimism for the future given these recent positive developments. Ultimately, we see these developments as a positive sign that the economy, markets, and pandemic are progressing towards recovery.

Print PDF > Is the Worst Behind Us?


The opinions expressed herein are those of Marquette Associates, Inc. (“Marquette”), and are subject to change without notice. This material is not financial advice or an offer to purchase or sell any product. Marquette reserves the right to modify its current investment strategies and techniques based on changing market dynamics or client needs.

Don’t Mind the Gap

On the surface it looks disjointed. We are in the midst of what is likely the worst recession since the Great Depression, but the stock market has rallied back in a matter of weeks and currently sits just 10% off all-time highs. Treasury yields appear to be pricing in an extended period of softness, and high yield spreads have only started to show signs of recovery. While the future is always an unknown, it feels as if we are facing a new level of uncertainty with many more moving parts.

In this newsletter, we explore equity market dynamics to help reconcile the apparent gap between the recent good news from equity markets and overwhelmingly negative news from the economy and bond markets.

Read > Don’t Mind the Gap


The opinions expressed herein are those of Marquette Associates, Inc. (“Marquette”), and are subject to change without notice. This material is not financial advice or an offer to purchase or sell any product. Marquette reserves the right to modify its current investment strategies and techniques based on changing market dynamics or client needs.

The Confluence of Small-Cap Stocks and the Economy

Small businesses are often thought of as the backbone of the U.S. economy. Long before the coronavirus, the Russell 2000 index, which tracks the performance of domestic small-cap companies, peaked at the end of August 2018. A warning sign of a slowing economy struck at the same time, with the peaking of the ISM Manufacturing Index (PMI), a gauge of domestic manufacturing activity. The tandem crest of these two indices is not too surprising as smaller companies that make inputs or provide services for larger entities are typically squeezed first when the going gets tough. Over the long-term, small-cap returns have shown a higher correlation with domestic manufacturing activity relative to mid- and large-cap returns. Despite the peak of these two indices, the S&P 500 Index, which tracks the performance of domestic large-cap companies, went on to return 16.7% from August of 2018 to its height in February of this year; small-cap returns were flat to negative over the same period. During the worst of the market decline, the Russell 2000 was down 44.1%, underperforming the S&P 500 by nearly 10%, and the PMI hit 41.5, a level not seen since the depths of the Global Financial Crisis. What explains the performance differential between these market cap indices and given the close relation to the PMI, what can we expect from small-cap stocks going forward?

Relative to large-cap, the performance gap lies in quality and construction. Many small companies in the index have low cash reserves, no profits, and debt-laden balance sheets. A lack of access to capital pushes small-cap companies to issue debt at higher rates, creating a lower threshold for quality. Additionally, the small-cap index is more cyclical in nature with a 15% total differential between sectors like interest rate sensitive financials and REITs, as well as economically sensitive industrials. Given this, we might expect the asset class to underperform in the twilight of the longest bull market in U.S. history. Secondarily, the small-cap index has broader sector and industry exposure than the S&P 500. As a result, the closure of the U.S. economy may prove detrimental for many smaller-sized businesses.

In evaluating the last two recessions, there is no consistency as to when the PMI will trough. However, U.S. small-cap returns tend to rebound after a trough in the PMI. Investors like to see a strengthening of the economy prior to betting on small-cap. Looking forward, small-cap stocks usually have better relative performance to their large-cap peers coming out of a recession. The Russell 2000 outperformed the S&P 500 in the last two recessions over the one- and two-year periods post-trough by an average of 26% and 94%, respectively. It is possible we are already starting to see a rebound in small-caps. As of May 26th, the Russell 2000 has outperformed the S&P 500 by nearly 5% month-to-date, the majority of which has accrued over the last week. Small-cap stocks have rebounded on broader containment, economic reopening, and optimism around vaccine development. As is true in every economic downturn, the players here are different; the insurgence of COVID-19 has created an unprecedented headwind for the economically sensitive Russell 2000 Index. Predicting sentiment changes is impractical at best, but as the U.S. consumer economy reopens, we hope to see falling unemployment, rising consumer confidence, and a bottoming of the PMI as domestic production ramps up.

Print PDF > The Confluence of Small-Cap Stocks and the Economy


The opinions expressed herein are those of Marquette Associates, Inc. (“Marquette”), and are subject to change without notice. This material is not financial advice or an offer to purchase or sell any product. Marquette reserves the right to modify its current investment strategies and techniques based on changing market dynamics or client needs.

There’s FAAMG and Everyone Else

Since the S&P 500 bottomed on March 23rd, the stock market has taken off while economic fundamentals have worsened. As of May 15th, the S&P 500 was up 28.4% from its trough while unemployment stands at 14.7%, April retail sales fell 16.4%, and industrial activity dropped by 15.5%. The S&P 500 has recouped more than 50% of its losses and sits just 15% below its all-time high.

Digging deeper into the underlying performance of the market, it becomes evident that not all of Wall Street has participated in the rebound. Market breadth, which compares the number of stocks that have gained relative to the ones that have declined, has been especially narrow. As a result, the market can be separated into a relatively few “Haves” and many “Have Nots.” The “Haves” are the largest five companies in the S&P 500: Facebook, Apple, Amazon, Microsoft, and Google (FAAMG) and the “Have Nots” are the other 495 companies in the index. Year-to-date as of May 15, 2020, the top five stocks returned 11.8% and outperformed the bottom 495 stocks before, during, and after the market decline. The bottom 495 stocks returned -15.3% year-to-date, representing a 27% performance gap. This leads us to two questions: Is the market rebound warranted? And, will the performance dispersion between the “Haves” and “Have Nots” fade anytime soon?

Equity markets are a forward-looking indicator of economic and corporate conditions. Yes, current fundamentals are not good, but analysts expect economic growth and corporate earnings to rebound later this year and into 2021, along with the development and release of a vaccine that can eradicate further outbreaks of COVID-19. In addition, stock markets often trough before the release of the worst economic data and before recessions end. Therefore, the forward-looking nature of the market seems to justify the market rebound to date.

Regarding the “Haves” and “Have Nots”, the market seems to believe the winners are large Technology companies and the losers are everyone else and/or any company exposed to COVID-19. There is fundamental support to favoring FAAMG. For example, Microsoft reported a 15% increase in sales, Google surpassed revenue expectations despite the potential for a decrease in advertising sales, and Apple has one of the most cash-rich balance sheets in the country. So, it is plausible that these stocks can continue to outperform. The longest period of similarly narrow breadth occurred in the two-plus years leading up to the bursting of the Tech Bubble. Consequently, periods of narrow breadth are often a harbinger of market declines and have “signaled below-average 1-, 3-, and 6-month S&P 500 returns as well as larger-than-average prospective drawdowns.”¹ We know that eventually the other 495 stocks in the S&P 500 will have more attractive fundamentals and will command higher prices. At that point, the return dispersion between the “Haves” and “Have Nots” will normalize, we just do not know when, though it will likely coincide with more positive economic data and greater containment of the coronavirus pandemic.

Print PDF > There’s FAAMG and Everyone Else

¹ Goldman Sachs Portfolio Strategy Research, May 1, 2020. “U.S. Weekly Kickstart.”


The opinions expressed herein are those of Marquette Associates, Inc. (“Marquette”), and are subject to change without notice. This material is not financial advice or an offer to purchase or sell any product. Marquette reserves the right to modify its current investment strategies and techniques based on changing market dynamics or client needs.