Getting That Paper

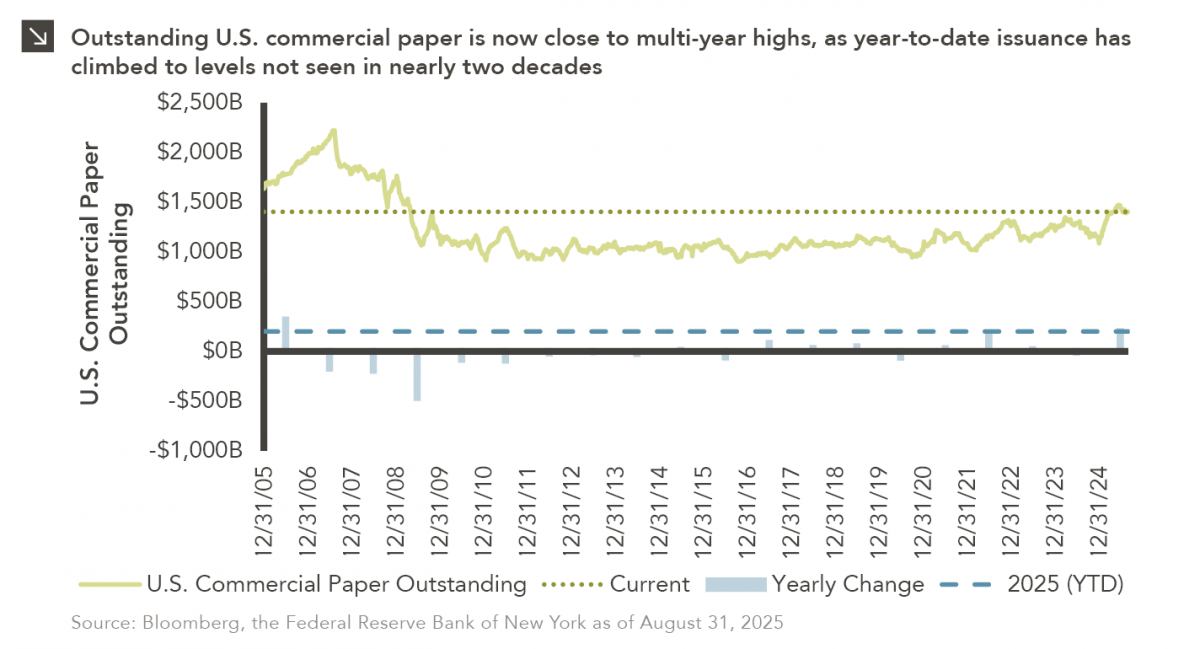
Commercial paper is a type of unsecured debt instrument that can be utilized by companies to finance short-term liabilities. The U.S. commercial paper market, which eclipsed $2 trillion in total value in 2007, was decimated in the aftermath of the Global Financial Crisis, with ultra-low interest rates pushing most companies toward longer-term obligations. That said, this method of financing is currently experiencing a revival, as 2025 has seen more than $200 billion in new U.S. commercial paper issuance. This is the highest figure notched in a calendar year since 2006. Indeed, major corporations including Uber, Netflix, Coca-Cola, PepsiCo, Philip Morris, and Honeywell have recently ventured into the commercial paper market, collectively raising billions through instruments that usually mature within one to three months. Total U.S. commercial paper outstanding stood at more than $1.4 trillion at the end of August.

The recent growth of the commercial paper market reflects a notable change in how U.S. companies are choosing to finance operations. With borrowing costs elevated and trade tensions persisting, firms have opted to bolster cash reserves while avoiding the higher expense of long-term debt, particularly as potential interest rate cuts from Federal Reserve loom. This trend is consistent with the approach of the U.S. Department of the Treasury, which has relied heavily on short-term T-bill issuance to cover government funding needs. It is important to note, however, that commercial paper utilization exposes issuers to certain risks. For instance, if long-term interest rates remain high, companies could be forced to regularly roll over short-dated obligations. A surge in short-term borrowing by both businesses and the government may also increase competition for investors, raising funding costs further.

What’s It All Worth?

In private markets, secondary transactions have increasingly gained attention and acceptance as a viable liquidity option for both general partners (“GPs”) and limited partners (“LPs”). During the first half of 2025, secondary market volume reached record levels, surpassing $100 billion for the first time in history. Specifically, volume totaled $102 billion in the first six months of the year, with a nearly even split between LP-led (53%) and GP-led (47%) transactions. To put this in perspective, secondary transaction volume for the entirety of 2022 was $103 billion. Although dry powder has declined in recent months — from $216 billion in 2024 to $171 billion — fundraising is expected to more than offset this decrease, with $218 billion projected to be raised over the next year.

As is common with most asset classes, increased market participation leads to more capital being raised and deployed, which, in turn, drives asset prices higher. The secondary market follows this same trend. Typically, secondary transactions are priced at a discount to the net asset value (“NAV”) of the assets or stakes being sold. However, secondary pricing across all private asset classes increased in 2024, reaching 89% of NAV (up from 85% in 2023). Buyout secondaries saw the highest pricing last year, trading at 94% of NAV, while pricing of private debt secondaries jumped from 77% of NAV in 2023 to 91% in 2024. In contrast, real estate secondaries traded at the lowest percentage of NAV, settling at 72% in 2024. This figure is more consistent with the 71% trading value exhibited by real estate secondaries in 2022 and 2023.

This brings us to the central question of this piece: What’s it all worth? Simply put, whatever someone is willing to pay! But how do we value an asset purchased at a discount? Can we trust the original valuation? Historically, secondary buyers have tended to mark acquired assets up relative to the previous owner’s NAV shortly after the transaction closes, but is this a fair and accurate way to value an asset? If buyers conduct thorough due diligence, their own assessments of a company or portfolio will inform their willingness to pay market-clearing prices, meaning pricing is not determined solely by the current value of an asset. Indeed, buyer perspectives on future growth potential, exit opportunities, and comparable market transactions all influence secondary market pricing. Additionally, recent strong capital inflow for the asset class may be putting pressure on acquirers to put money to work, potentially contributing to the recent uptick in pricing.

The Day Credit Spreads Died

July 31, 1997 is a date which will live in infamy. On this day, FedEx Express Flight 14 crashed at Newark International Airport, baseball slugger Mark McGwire was traded from the Oakland Athletics to the St. Louis Cardinals, and the Lehman Corporate Index hit an all-time tight of 51 basis points. While not quite at all-time tight levels, credit spreads are currently partying like it’s (almost) 1999. Specifically, the Bloomberg Corporate Index, the successor to the Lehman Corporate Index, sat at 75 basis points as of August 22, 2025, the lowest level in more than 25 years. And you may ask yourself: “Well, how did I get here?”

Tight credit spreads generally indicate that investors see less risk in the market relative to government bonds, and current spreads can be examined using a combination of macroeconomic, fundamental, and technical factors. On the macroeconomic front, tariff-related volatility in the first half of 2025 caused spreads to widen, but this widening was followed quickly by a return to lower levels given progress with trade negotiations. Additionally, a strong second quarter GDP figure and moderating inflation have provided a strong backdrop for credit. When it comes to fundamentals, credit also appears healthy. The COVID-19 pandemic gave companies the opportunity to strengthen balance sheets by terming out debt at low interest rates, while corporate earnings remain favorable. With more than 92% of S&P 500 Index constituents reporting, expectations are for EPS growth of roughly 11% for the benchmark in the second quarter (on a year-over-year basis). This figure far exceeds the consensus pre-earnings estimate of 5%. Higher coverage ratios, combined with leverage ratios that have fallen significantly since the Global Financial Crisis, creates a solid fundamental backdrop for credit. Finally, on the more technical side, strong demand for risk assets has stretched valuations, and the correlation between fund inflows and credit spreads is very high. Indeed, as most bond investors are yield buyers, higher base rates have made the fixed income space more attractive, and this dynamic has pushed spreads tighter.

In conclusion, a solid macroeconomic background, strong fundamentals, and technical factors have driven credit spreads to near historic tights. Barring an exogenous market shock, spreads may remain tight in the coming months, meaning investors should exercise caution when it comes to credit given the little room for error conditions currently provide.

The Impact of Artificial Intelligence on Markets

Over the last several decades, artificial intelligence (“AI”) has evolved from a theoretical concept into a transformative force across a variety of industries. The 1940s saw the advent of the digital computer, which was followed years later by the first artificial neural network, a computational model inspired by the structure of the human brain that consists of algorithms that attempt to recognize relationships in data. In more recent years, researchers have developed “deep learning” systems (i.e., neural networks with many layers) capable of increasingly complex tasks including image recognition, reading comprehension, and predictive reasoning. Given the advances in the space, it should not come as a surprise that the use cases of artificial intelligence are now vast, with AI tools now implemented across fields including health care, retail, finance, and entertainment. Researchers and corporate executives are not the only ones to have noticed the remarkable potential of AI, however, as investors have flocked to the space in droves over the last several years.

This newsletter outlines the growth of AI as an investment theme, including performance, valuations, and earnings growth of AI-related companies and equities, other segments of the market that may stand to benefit from advances in AI, and potential risks for investors.

Alternatives in Defined Contribution Plans

On August 7, 2025, President Trump signed an executive order to expand alternative investment access in defined contribution retirement plans (e.g., 401(k) plans). This order instructs the Department of Labor (DOL) to reexamine its guidance to plan sponsors incorporating alternative investments into these types of retirement plans. According to the order, the six classes of alternative assets included are:

  • Private markets investments, including private equity and private debt
  • Real estate
  • Actively managed vehicles investing in digital assets
  • Commodities
  • Infrastructure
  • Lifetime income strategies, including longevity risk-sharing pools

All Eyes on Jackson Hole

Predictions that the Federal Reserve is set to lower interest rates will be put to the test this week as Chair Jerome Powell prepares to outline his view of the economy at the central bank’s annual symposium in Jackson Hole, Wyoming. Most anticipate a more dovish tone from Powell in his remarks on Friday due to weakening labor market dynamics, though recent inflation figures have tempered some of that optimism. While a monetary policy decision will not be made at the Jackson Hole symposium, Powell’s comments are sure to provide insight into what might occur at the Fed’s September meeting, at which there is an 85% chance of a 25 basis point rate cut according to prediction markets. All told, the central bank has three remaining opportunities to make changes to its policy rate in 2025.

Comments from Fed chairs at Jackson Hole have proven significant in the past. For instance, Powell warned that controlling inflation would require economic pain in his speech three years ago, and these remarks sent short-term yields higher. Additionally, at last year’s symposium, he indicated that the Fed was prepared to lower borrowing costs from multi-decade highs, triggering a sharp drop in both the 2- and 10-year Treasury. Yields have retreated across most maturities in recent weeks following a lackluster July jobs report, with the 2-year yield now hovering around 3.75%, meaning a material reaction to Powell’s speech could send short-term yields to multi-year lows.

In the weeks ahead, attention will shift from Jackson Hole to the August jobs report, which could solidify expectations for an interest rate reduction in September. Investors should note, however, that monetary easing would come at a time when inflation remains above target and fiscal stimulus from the Trump administration’s recent spending package looms large. Those dynamics, combined with concerns about political interference at the Fed and recent changes in leadership at the Bureau of Labor Statistics, could lead investors to demand higher compensation for holding longer-dated Treasuries.

3 vs. 2000

In last year’s “2 vs. 2000” Chart of the Week publication, we explored the emergence of trillion-dollar companies, noting that Microsoft and Apple had each exceeded the combined market capitalization of Russell 2000 Index constituents. Since then, another technology giant has crossed that threshold, with NVIDIA recently becoming the first company to reach a market capitalization of $4 trillion. While Microsoft currently hovers around this level thanks to robust earnings and demand for its cloud and enterprise solutions, Apple has experienced more turmoil in recent time. In the first three months of this year, Apple shed nearly $1.5 trillion from its market capitalization amid trade tensions and concerns about slowing growth. During this bout of volatility, the company briefly became smaller than the U.S. small-cap equity universe, but a rally sparked by its announcement to bring manufacturing back to the U.S. helped Apple regain its footing and once again surpass the Russell 2000 Index in terms of market capitalization.

The meteoric rise of Apple, Microsoft, and NVIDIA underscores ongoing investor preferences for large-cap, technology-focused companies. In contrast, the U.S. small-cap space, which is more tilted toward businesses in sectors like Financials and Industrials, has struggled in recent years for this same reason. The Russell 2000 Index has also been negatively impacted by the realization of smaller company growth within private markets, as outlined in a recent newsletter. Going forward, investors should be cognizant of the risks posed by both large and small companies and remain adequately diversified across the market capitalization spectrum.

Treasury Market Creates a Balancing Act

Despite the U.S. economy’s impressive growth in recent decades, the federal government currently faces elevated borrowing costs to fund its persistent budget deficits. While current bid-to-cover ratios remain robust in absolute terms, a declining trend in shorter maturities could represent one early warning sign that the traditional investor base demand is waning.

This newsletter examines the Treasury’s challenge of balancing funding costs with market demand and potential fiscal and monetary policy implications.

Reversal of Fortune

The U.S. employment report released last Friday by the Bureau of Labor Statistics (“BLS”) painted a significantly weaker picture of the current labor market. While the domestic economy added roughly 73,000 jobs in July and the unemployment rate ticked up only slightly to 4.2%, the publication included the sharpest downward revisions to previously reported job growth statistics since the COVID-19 pandemic. Specifically, estimates for nonfarm payrolls in May and June were reduced by 260,000. A large share of this downgrade came from state and local government education payrolls, which initially appeared to drive job growth in June but accounted for roughly 40% of recent revisions according to Bloomberg.

Notably, revisions to payroll statistics throughout this year have been consistently downward, with job counts adjusted lower for every month in 2025 to this point. Economists attribute these adjustments to both seasonal recalculations and the growing challenge of lower response rates from surveyed businesses. Indeed, initial response rates to BLS surveys, which sat at around 70% before the pandemic, have slipped below 60% in recent months, which could reflect fatigue or waning trust in institutions on the part of participants. It is also important to note that the government agencies tasked with conducting surveys of businesses and consumers are operating under increasingly tighter budgets, making it more difficult to create an accurate representation of the economic landscape. For instance, the BLS recently disclosed that roughly 15% of the sample used to compile the consumer price index, a key inflation gauge, was suspended from collection due to resource constraints.

President Donald Trump was quick to respond to Friday’s jobs report, dismissing BLS Commissioner Erika McEntarfer and alleging that the publication was manipulated for political reasons. Additionally, Federal Reserve Governor Christopher Waller pointed to labor market data revisions as a key reason for his recent vote to lower interest rates. While the Fed ultimately opted to keep its policy rate unchanged at its July meeting, further deterioration of labor market data may require more expeditious easing from the central bank in the months ahead.

Non-U.S. Stocks: Currency Leads, Earnings Lag

There was a striking reversal in equity performance trends during the first half of 2025, with non-U.S. stocks outperforming their U.S. peers by a significant margin. Specifically, the MSCI ACWI ex-U.S. and Russell 3000 indices returned 17.9% and 5.8%, respectively, on a year-to-date basis through June 30. While it is unclear whether this shift is a temporary phenomenon or the unraveling of a multidecade pattern, a deeper exploration of year-to-date returns for various equity benchmarks may provide some answers. Notably, currency movements, particularly the weakening of the U.S. dollar, have played an outsized role in the returns of non-U.S. stocks this year, adding 14% and 9% to the total year-to-date returns of the MSCI Europe ex-UK and MSCI Japan indices, respectively. Multiple factors have contributed to this bout of dollar weakness, including uncertainty regarding tariffs, concerns about the U.S. fiscal deficit, and a growing global interest in diversifying into non-U.S. assets. European and Asian equities have benefitted from these dynamics, with both regions experiencing strong capital flows in the first half of the year. This helps explain the second-largest return driver for international equities in 2025: multiple expansion. Indeed, improving investor sentiment and capital inflows have recently propelled international equity valuations above their long-term averages. Pledges for increased defense spending and infrastructure development in Europe (as described in a recent Chart of the Week) are especially stoking enthusiasm among investors, with fiscal stimulus measures and rate cuts serving as additional sentiment tailwinds.

While the factors detailed above warrant excitement about non-U.S. equities, it is prudent to address the risks facing the asset class as well. To that point, a third takeaway from the return decomposition detailed above is what is nearly absent from the total return of Europe and Japan: meaningful earnings growth. While certain sectors of the non-U.S. market, such as Financials and Information Technology, have strong growth projections, broad earnings expectations are mixed, with European companies expected to report a 0.3% drop in earnings for the second quarter. In conclusion, there is certainly a case for optimism related to the prospects of non-U.S. stocks going forward, but it is important to underscore the importance of earnings growth as the key driver of long-term returns.