Recent days have proved quite challenging for equity investors. On the international front, the Nikkei 225 — which tracks the performance of large, public companies in Japan — dropped by more than 12% in Monday’s trading session. This figure represents the most significant single-day drawdown for that index in more than 35 years. Other non-U.S. equity benchmarks have exhibited similar pullbacks: The MSCI EAFE and MSCI EM indices are both down roughly 6% on a month-to-date basis as of the time of this writing. Performance has been similarly challenged for domestic stocks, with the S&P 500 and Russell 2000 indices down around 6% and 10%, respectively, over that same period. Perhaps unsurprisingly, the CBOE Volatility Index (“VIX”) reached a level not seen in more than four years during Monday’s trading session as investors grappled with broad market turbulence. Despite some moderation throughout the Monday session, the VIX remains well above its 10-year average after a prolonged period of muted volatility. These dynamics can be observed in the chart above.
As is often the case during market downturns, there is not a single force driving recent performance but rather a variety of factors at play. Some of the factors in this case include the following:
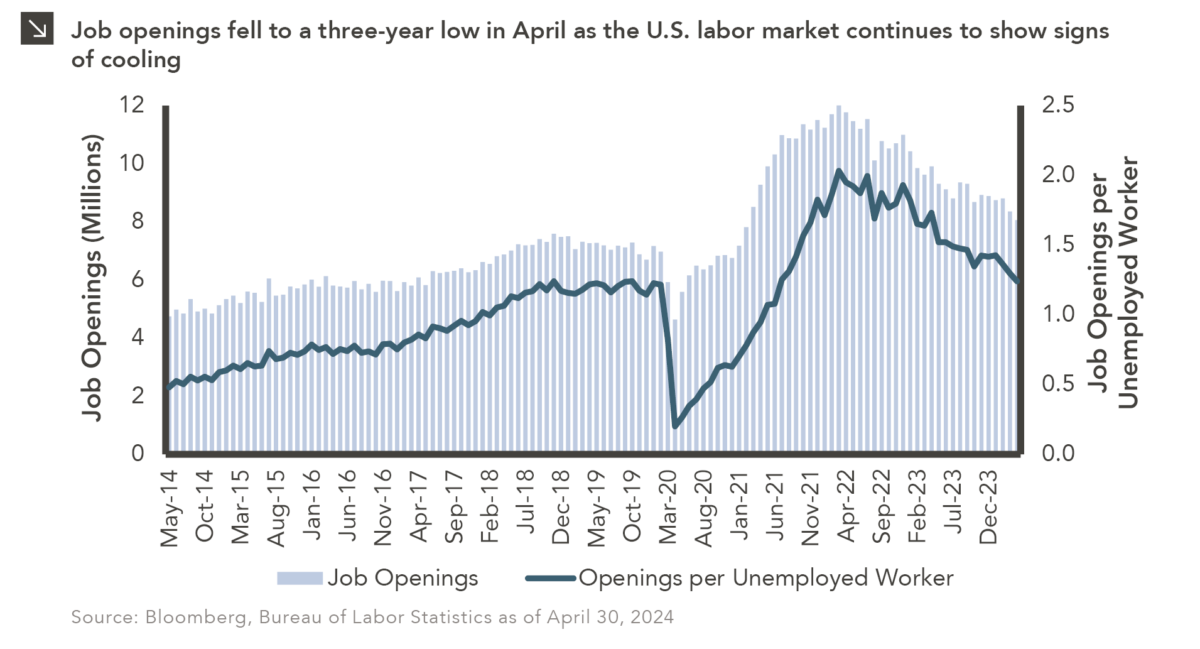
- Friday’s lackluster jobs report, which detailed a higher U.S. unemployment rate (4.3% in July vs. 4.1% in June) and monthly nonfarm payroll gains for the last month that came in well below expectations (114,000 realized vs. 185,000 estimated). These and other souring economic data points may be leading investors to question the extent to which a soft economic landing can truly be achieved in the months ahead.
- Waning enthusiasm surrounding the artificial intelligence trade, which has led to historically high concentration risk within many indices. Price drops of many large index constituents, many of which have benefitted from AI-related fervor, have exacerbated pressures on U.S. equity benchmarks in particular.
- Technical factors, particularly related to a popular carry trade featuring the Japanese yen. A stronger yen and an unwinding of global yen carry trades, wherein investors borrowed in the low-yielding currency and reinvested the proceeds elsewhere, have created a negative feedback loop that has led to equity price pressures.
The dynamics described above have further clouded the future. As recently as last month, market participants expected roughly two rate cuts from the Federal Reserve for the remainder of 2024; now that figure sits at around five, with two 25 basis point cuts forecasted at the next FOMC meeting in September. To that point, the yield on the 2-Year Treasury, which closely tracks expectations surrounding Fed policy, briefly sank below 3.7% on Monday before pulling back to around 3.9% later in the trading session.
It is important to remember that the current market decline is not unprecedented. Investors should recall that equity indices are prone to corrections, with the S&P 500 Index exhibiting a drawdown of 10% or greater in 19 of the last 30 calendar years. As always, we encourage investors to maintain a long-term outlook related to their portfolios and not overreact to short-term volatility. A disciplined portfolio rebalancing policy coupled with a long-term strategic asset allocation is the most proven method to achieve risk and return objectives.