1Q 2024 Market Insights Video

This video is a recording of a live webinar held April 25 by Marquette’s research team analyzing the first quarter of 2024 across the economy and various asset classes and themes we’ll be monitoring in the coming months.

Our quarterly Market Insights series examines the primary asset classes we cover for clients including the U.S. economy, fixed income, U.S. and non-U.S. equities, hedge funds, real assets, and private markets, with commentary by our research analysts and directors.

Sign up for research alerts to be invited to future webinars and notified when we publish new videos. If you have any questions, please send us an email.

2024 Market Preview Video

This video is a recording of a live webinar held January 25 by Marquette’s research team analyzing 2023 across the economy and various asset classes as well as what trends and themes we’ll be monitoring in the year ahead.

Our quarterly Market Insights series examines the primary asset classes we cover for clients including the U.S. economy, fixed income, U.S. and non-U.S. equities, hedge funds, real assets, and private markets, with commentary by our research analysts and directors.

Sign up for research alerts to be invited to future webinars and notified when we publish new videos. If you have any questions, please send us an email.

3Q 2023 Market Insights Video

This video is a recording of a live webinar held on October 26 by Marquette’s research team, featuring in-depth analysis of the third quarter and themes we’ll be monitoring for the remainder of the year.

Our Market Insights series examines the primary asset classes we cover for clients including the U.S. economy, fixed income, U.S. and non-U.S. equities, hedge funds, real estate, infrastructure, private equity, and private credit, with presentations by our research analysts and directors.

Sign up for research alerts to be invited to future webinars and notified when we publish new videos. 
For more information, questions, or feedback, please send us an email.

Selling Insurance: An Option for Diversification

The Aflac Duck, the LiMu Emu, and the GEICO Gecko may be fictional insurance salespeople (or sales-animals, perhaps), however, the market participants involved in the selling of financial insurance are all too real. Put options are a popular form of such insurance, as these instruments afford the option holder the right to sell an underlying security at a given level, effectively insulating the holder against significant drops in the price of the underlying security. That said, much like bundling your home and auto with Jake from State Farm, this insurance comes at a cost based on implied volatility. For those who choose to purchase options contacts on the broad-based S&P 500 Index as a means of insuring portfolios against losses, this implied volatility is measured by the VIX Index, which uses at-the-money S&P 500 Index options to assess expectations of near-term market fluctuations. Over the long term, these expected volatility levels tend to be higher than what is actually exhibited. Specifically, since the start of 1990, implied volatility of the S&P 500 Index was greater than what was subsequently realized in roughly 87% of daily observations, and the difference between the two was roughly 4.5% on average over the same time period. This phenomenon leads to the systematic over-pricing of put option contacts and is highlighted in the top half of this week’s chart.

The data points noted above demonstrate the fact that selling insurance contracts on the U.S. equity market has generally been a profitable endeavor over the last several decades. To that point, the CBOE S&P 500 PutWrite Index, which is comprised of short positions in at-the-money put options on the S&P 500 Index and short-term Treasury bills which serve to collateralize the option positions, is an effective tool for measuring exactly how beneficial this activity can be for investors. On a trailing 10-year basis as of September 30, the PutWrite index notched an annualized return of 6.7%. While this is significantly lower than the 13.1% figure for the S&P 500 over the same period, the PutWrite benchmark has notably delivered that performance with a lower annualized standard deviation — 9.7% vs. 15.0% for the S&P 500. Performance of the PutWrite benchmark during down markets has been particularly compelling, with the index outperforming the S&P 500 in six of the last seven calendar years during which the S&P 500 was negative. This performance pattern can be observed in the bottom half of this week’s chart. It is important to note that active managers within the space can provide additional value over the PutWrite index by selling the most attractive options, diversifying the portfolio of options across different strike prices and tenors, and optimizing the pool of cash with which the options are collateralized.

Readers should be aware of the fact that options selling is not without risk. Performance typically lags during strong, upward-trending markets, and a relatively high equity beta means that these types of strategies will be more correlated to stock market movements than other diversifying alternatives. That said, options-based strategies could present attractive opportunities for many investors due to the systematic processes with which they are implemented, the lower fees and better liquidity terms associated with them relative to other alternatives, and the likelihood that the volatility risk premium will persist into the future. Marquette will continue to monitor the persistence of this premium, conduct due diligence on investment managers in the options space, and provide education and recommendations to clients accordingly.


The FTC vs. M&A

Higher interest rates have broadly impacted capital markets, including M&A deal flow given the significant increase in financing costs. Along with that, elevated regulatory risk has been another headwind for the space.

Since her appointment as Chair of the Federal Trade Commission (FTC) in June 2021, Lina Khan has emerged as one of the most aggressive anti-trust leaders the U.S. and Wall Street have seen in some time. For large corporations seeking growth via M&A, the regulatory requirements for FTC approval have increased significantly. Deals that would likely have been approved with ease in prior administrations now face costly lawsuits, injunctions, and other challenges by the Commission. Coupled with higher financing costs, the FTC’s aggressive agenda has significantly prolonged the timeline for deals to close. In the second quarter of 2023, completed M&A deal volumes came in at mere $95 billion, just above the $83 billion of deals closed at the height of COVID in the second quarter 2022. At the same time, the volume of pending deals awaiting regulatory approval has substantially increased, reaching $183 billion in the second quarter.

The FTC’s actions have had a clear impact on the M&A environment, leading to significantly wider deal spreads in 2023 amid increased uncertainty. This is both an opportunity and a risk for hedge funds specializing in merger arbitrage. While deal spreads appear attractive, they come with heightened risks that require expertise to successfully navigate. For investors, selecting experienced managers with a proven track record of success across different regulatory regimes is critical to achieving favorable risk-adjusted returns.

Print PDF > The FTC vs. M&A


The opinions expressed herein are those of Marquette Associates, Inc. (“Marquette”), and are subject to change without notice. This material is not financial advice or an offer to purchase or sell any product. Marquette reserves the right to modify its current investment strategies and techniques based on changing market dynamics or client needs.

2023 Halftime Market Insights Video

This video is a recording of a live webinar held July 19 by Marquette’s research team, featuring live, in-depth analysis of the second quarter and themes we’ll be monitoring in the second half of the year.

Our Market Insights series examines the primary asset classes we cover for clients including the U.S. economy, fixed income, U.S. and non-U.S. equities, hedge funds, real estate, infrastructure, private equity, and private credit, with presentations by our research analysts and directors.

Sign up for research alerts to be invited to future webinars and notified when we publish new videos.
For more information, questions, or feedback, please send us an email.

Bear Scare?

The S&P 500 index — up 9.6% on a year-to-date basis through May — recently entered into a technical bull market, mostly due to a resurgence of growth-oriented areas of the U.S. equity space like Information Technology and Communication Services. At the same time, data related to futures contracts on the index could indicate extremely bearish sentiment on the part of hedge funds and speculators. As of the end of last month, these investors and traders were net short more than 400,000 E-mini S&P 500 futures contracts — the largest such position since Bloomberg started tracking the metric in the early 2000s.

There are several potential explanations for this phenomenon. First, investors may believe the recent run of the S&P 500 is not reflective of the current economic climate and overly dependent on a small basket of securities. To that point, the year-to-date return of the benchmark would actually be negative through the end of May excluding just seven high-performing index constituents (Alphabet, Amazon, Apple, Meta, Microsoft, NVIDIA, and Tesla). This type of sentiment could lead the index to retract meaningfully should one of these companies stumble. However, this same group of investors has maintained net long positions on similar NASDAQ futures contracts in recent time, which does not support the notion that investors are inordinately bearish on these stocks. Dynamics within S&P 500 futures markets could also be a reflection of hedge funds and other investors having a significant number of high-conviction long positions with fewer alpha short ideas, which could necessitate hedging to lower net exposures and would actually be a bullish indicator. Whatever the reason for this positioning, it is important for investors to remember that no one variable is sufficient when it comes to explaining overall market machinations. Marquette will continue to monitor equity and futures markets and advise clients accordingly based on our findings.

Print PDF > Bear Scare?


The opinions expressed herein are those of Marquette Associates, Inc. (“Marquette”), and are subject to change without notice. This material is not financial advice or an offer to purchase or sell any product. Marquette reserves the right to modify its current investment strategies and techniques based on changing market dynamics or client needs.

1Q 2023 Market Insights Video

This video is a recording of a live webinar held April 20 by Marquette’s research team, featuring in-depth analysis of the first quarter of 2023 and themes we’ll be monitoring in the coming months.

Our Market Insights series examines the primary asset classes we cover for clients including the U.S. economy, fixed income, U.S. and non-U.S. equities, hedge funds, real estate, infrastructure, private equity, and private credit, with presentations by our research analysts and directors.

Sign up for research alerts to be invited to future webinars and notified when we publish new videos.
For more information, questions, or feedback, please send us an email.

The Short Rebate: A Headwind Becomes a Tailwind

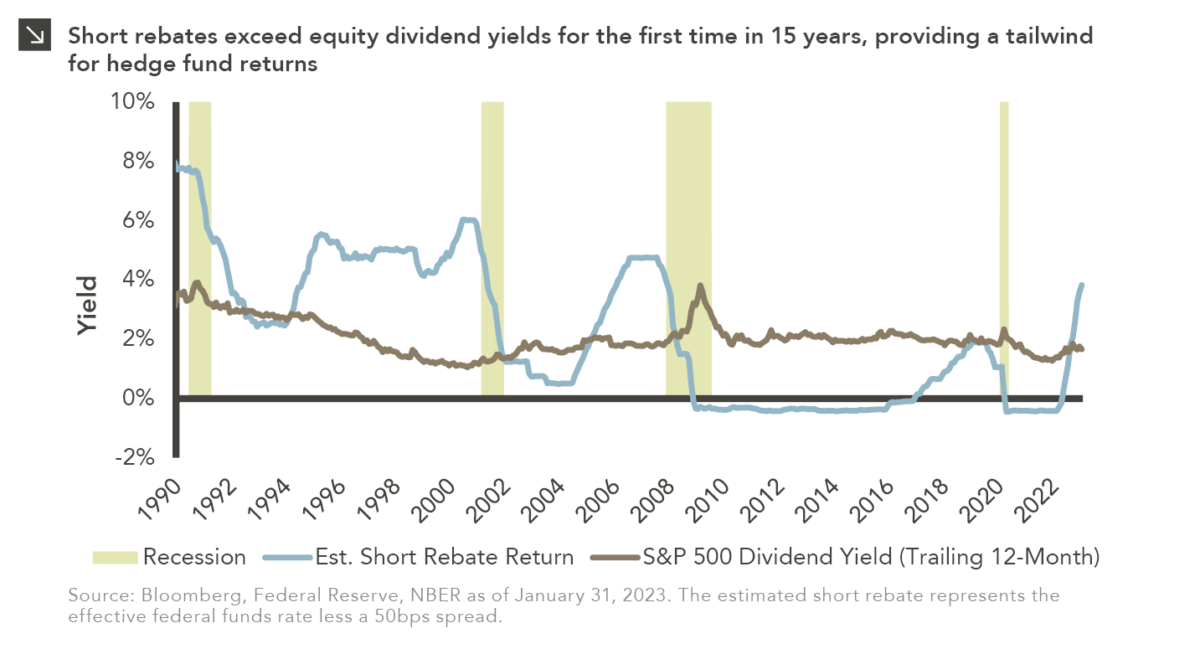
Investor focus over the last year has centered on the Federal Reserve and rising interest rates. Since March 2022, the federal funds rate has increased 450 basis points, with further rate hikes expected in the next six months. While the Fed’s intent is to lower inflation and create price stability, higher rates have widespread implications for the economy and markets. While many have focused on the challenges for investors, hedge funds, particularly those that have the ability to short stocks and bonds, are also set to benefit from the increase in rates.

To establish a short position, a hedge fund must first borrow the security from other asset owners, providing cash collateral to the security lender to protect against potential default. During the borrowing period, the hedge fund that borrowed the stock must pay the lender any dividends or interest received, but is also entitled to receive back any interest that accrues on the required collateral. The return earned on the collateral, known as the short rebate or stock loan rebate, can meaningfully contribute to a hedge fund’s return, particularly for funds with meaningful short portfolio allocations.

For the past 15 years, the short rebate, estimated as the federal funds rate less a fee charged for borrowing a security (typically between 25 and 75 basis points), had been less than the dividend yield on the S&P 500, equating to a headwind to returns for short sellers. However, with short rebates now firmly in positive territory, hedge funds can benefit from higher expected returns in a segment of their portfolio that has been challenged since the Global Financial Crisis. While overall hedge fund returns will still be dependent on manager security selection and exposure management, the short rebate flipping from a headwind to a tailwind is just one of the reasons that the go-forward environment should be more favorable than it has been for relative hedge fund outperformance.

Print PDF > The Short Rebate: A Headwind Becomes a Tailwind


The opinions expressed herein are those of Marquette Associates, Inc. (“Marquette”), and are subject to change without notice. This material is not financial advice or an offer to purchase or sell any product. Marquette reserves the right to modify its current investment strategies and techniques based on changing market dynamics or client needs.

2023 Market Preview: Trail Guide to 2023 Asset Class Performance

As winter takes hold in the northern hemisphere, there are those that choose to escape to warmer climates and those that embrace the season and choose the mountains. Anyone familiar with downhill skiing knows that every ski trail is marked with a shape and color to designate its difficulty. For those unfamiliar with these ratings, the North American system looks like this:


Of course, weather and trail conditions can also impact a trail’s difficulty and must be accounted for when turning down the mountain: environment and terrain matter. Similarly, investment prognostications must recognize the current setting. By now, the environment is all too well known: high inflation, aggressive Fed policy, Russia–Ukraine war, labor supply shortages, and a potential recession. These topics have been covered extensively in recent letters and continue to loom over markets as we start 2023. At a high level, general consensus is that the majority of rate hikes from the Fed are behind us (two are expected for 2023 at time of writing), and inflation will continue to normalize in 2023, thus further supporting the thesis of fewer rates hikes from the Fed over the next year. If a recession comes to fruition, expectations are for it to be short-lived and shallow which reduces the long-term threat to markets.

With this backdrop in mind, we turn our attention to an asset class by asset class outlook for the coming year, assessing the degree of difficulty for each to deliver positive returns in 2023. In some cases, the difficulty will change as the year goes on — similar to trails that are “Most Difficult” for the first half and become more palatable as the journey goes on…which brings to mind a certain trail in Utah that the author found himself on last year that literally had him over his skis…but I digress. Tighten your boots and click into those skis!

Read > Trail Guide to 2023 Asset Class Performance

Download > 2023 Market Preview Report with 100+ additional charts and data, organized by asset class

Watch >  2023 Market Preview Video recording of our research team’s live webinar analyzing last year’s performance as well as trends, themes, opportunities, and risks to watch for in 2023


The opinions expressed herein are those of Marquette Associates, Inc. (“Marquette”), and are subject to change without notice. This material is not financial advice or an offer to purchase or sell any product. Marquette reserves the right to modify its current investment strategies and techniques based on changing market dynamics or client needs. Marquette is an independent investment adviser registered under the Investment Advisers Act of 1940, as amended. Registration does not imply a certain level of skill or training. More information about Marquette including our investment strategies, fees, and objectives can be found in our ADV Part 2, which is available upon request.