Second Quarter Review of Asset Allocation: Risks and Opportunities

Overall, the second quarter was positive for financial markets, thanks to strong economic fundamentals and expected Fed stimulus. Unemployment remains low at 3.7% and inflation (1.8% year over year) is near the Fed’s long-term target of 2%. However, there are increasing concerns about a global economic slowdown and early forecasts for 2Q GDP growth are around 1.5%, far lower than what we’ve seen in recent quarters. Globally, the most important trends we see are the following:

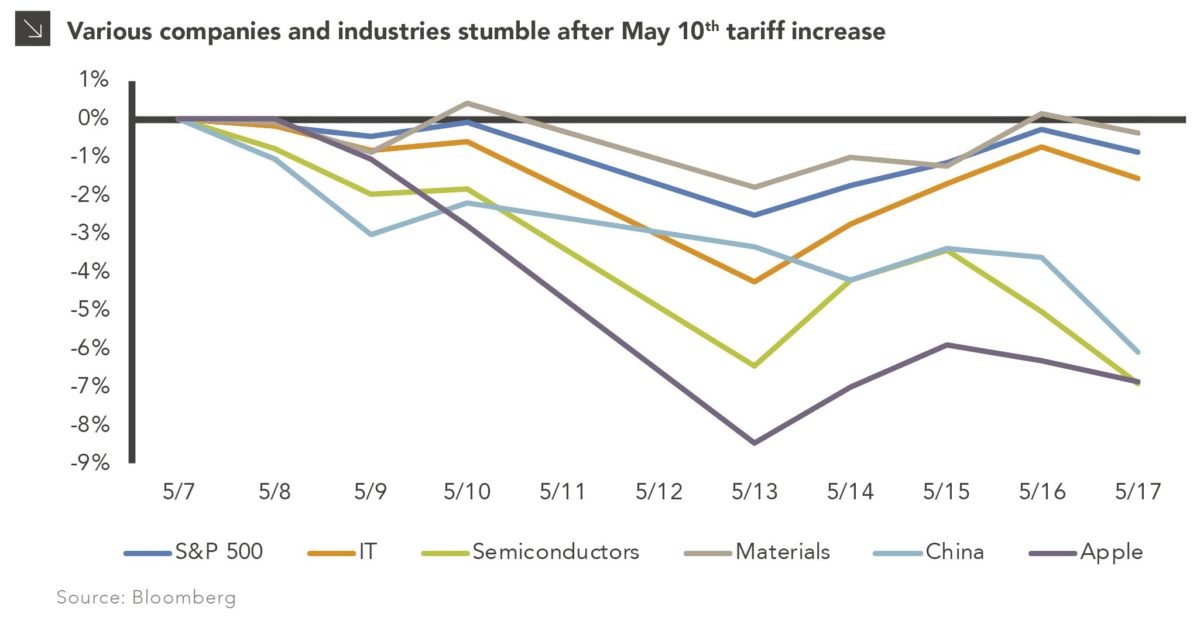
  • The U.S.-China trade conflict remains ongoing as talks between the two countries resumed, but little progress has been made;
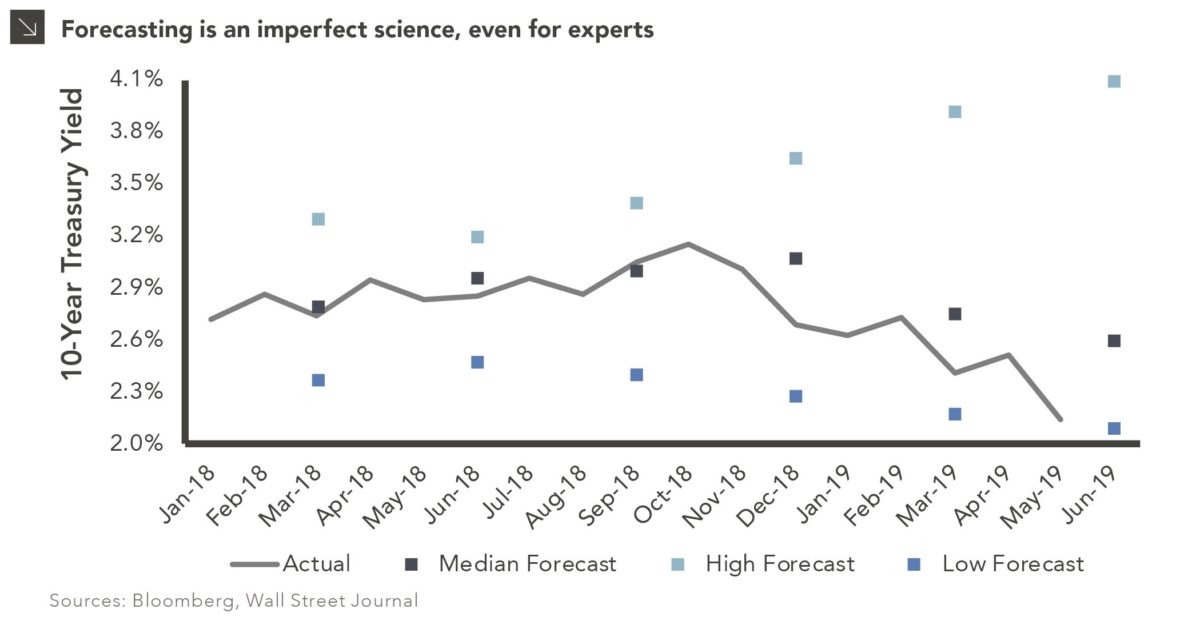
  • The Federal Reserve is expected to cut rates in July and markets are forecasting another one to two cuts by the end of the year;
  • Business sentiment is declining ­— most notably in the PMI manufacturing index, which is now dangerously close to falling below its growth threshold;
  • Britain continues to struggle with its Brexit and elected a new PM (Boris Johnson) on July 23rd;
  • China and Europe are expected in increase their stimulus measures to combat slow growth and overall global uncertainty;
  • Late-cycle dynamics in credit and equity markets.

The impact of these trends is explored further in this newsletter as we review second-quarter performance and expectations going forward for each of the major asset classes.

Read > Second Quarter Review of Asset Allocation: Risks and Opportunities

The opinions expressed herein are those of Marquette Associates, Inc. (“Marquette”), and are subject to change without notice. This material is not financial advice or an offer to purchase or sell any product. Marquette reserves the right to modify its current investment strategies and techniques based on changing market dynamics or client needs.

Boris Johnson Wins Tory Leadership

It’s official. At approximately 12:05 p.m. BST and after a six-week political race, the front-runner, Boris Johnson, won the Conservative Party contest to be the next Tory leader and succeed Theresa May as British prime minister. With the promise of delivering Brexit by October 31st, “come what may,” Johnson trounced his opponent, U.K. Foreign Secretary Jeremy Hunt, garnering more than 66% of the roughly 160,000 votes.

This newsletter outlines the potential effects of Boris Johnson’s election, including Brexit fears, market reaction, and its impact on the U.K. government and economy.

Read > Boris Johnson Wins Tory Leadership

The opinions expressed herein are those of Marquette Associates, Inc. (“Marquette”), and are subject to change without notice. This material is not financial advice or an offer to purchase or sell any product. Marquette reserves the right to modify its current investment strategies and techniques based on changing market dynamics or client needs.

Real Estate: Where Do We Go From Here?

Over the last ten years, core real estate as measured by the NFI-ODCE has delivered an annualized return of almost 9% and has helped boost institutional portfolio returns. However, given the consensus view that we are in the late stage of the economic cycle, coupled with overall global uncertainty and moderating returns in the asset class, investors are wondering if it is time to reduce their allocation to real estate, and if so, where they should allocate these funds.

The following article strives to answer these questions by analyzing the current landscape for real estate investments, including opportunities outside of the traditional “core” strategies that have historically constituted the majority of real estate investments for our clients. Furthermore, we offer guidance on where to allocate assets outside of the real estate asset class if investors have built up overweights to the asset class over the last decade of outperformance.

Read > Real Estate: Where Do We Go From Here?

The opinions expressed herein are those of Marquette Associates, Inc. (“Marquette”), and are subject to change without notice. This material is not financial advice or an offer to purchase or sell any product. Marquette reserves the right to modify its current investment strategies and techniques based on changing market dynamics or client needs.

The Evolution of Private Credit

With roughly $48B of U.S. private credit fundraising taking place in 2018 ­­— surpassing 2008 levels of $42B — private credit has established itself as an up-and-coming leader within the alternative space. By 2023, private credit is estimated to reach $1.4T in AUM, becoming the 3rd largest alternative asset class. This kind of success has brought with it increased competition, robust inflows, rising pools of dry powder and an inflow of managers within the space, up from 31 managers in 2010 to more than 130 in 2018.

The growth of available capital in the private credit market has been substantial, but the growing demand for debt has kept the opportunity largely intact. Direct lending, which is more prevalent in the middle-market, has rapidly developed into a meaningful source of debt capital within the private equity (“PE”) ecosystem.

Since the global financial crisis, the leveraged loan market has become less accessible to middle-market companies as banks have generally stopped lending in this part of the market. The volume of leveraged loans held by banks reached roughly 30% in 2008 and has since declined sharply to less than 10% today. Coupled with a 48% drop in the total number of U.S. banks from 1998 to 2018, demand for direct lending has increased as U.S. banks have substantially withdrawn from the market.

In their relentless search for yield, institutional investors stepped up in a meaningful way vis-à-vis direct lenders, and while highly competitive right now, direct lending brings PE-style returns with heightened levels of downside protection. Because private credit investments can be approached in a defensive, risk-controlled way, private credit is especially well suited for late-cycle conditions, and with its higher coupons, robust cash flows, and lower risk profile, we can expect private credit to continue to grow at an accelerated pace and become a consistent component of an increasing number of institutional investors’ portfolios.

Print PDF > The Evolution of Private Credit

The opinions expressed herein are those of Marquette Associates, Inc. (“Marquette”), and are subject to change without notice. This material is not financial advice or an offer to purchase or sell any product. Marquette reserves the right to modify its current investment strategies and techniques based on changing market dynamics or client needs.

Are Americans Swimming in Debt Again?

The eleven-year recovery since the 2008 financial crisis has been good for most Americans, allowing many to pay off debt and build a solid footing again. However, as this market cycle is getting a bit long in the tooth, investors are rightly concerned about areas of fundamental deterioration and whether the next recession might be lurking around the corner.

This week’s chart looks at the total amount of consumer debt in the U.S. The chart shows the aggregate amount of mortgage debt, home equity lines of credit, auto loans, credit card debt and student loans among U.S. households. We can see that in total, the amount reached roughly $13 trillion at the peak of the 2008 crisis, fell to a trough of about $11 trillion in 2013, but has now surpassed 2008 levels to about $14 trillion today, with especially high growth in the total student loan amount.

While nominal numbers can be informative, finance is the study of ratios, which can be even more insightful. If we divide the total nominal consumer debt amount by the U.S. population at key dates, we determine that total consumer debt was $24.93 per person in 2003, reaching a peak of $41.68 per person in 2008, dropping to a trough of $35.27 per person in 2013, but again surpassing 2008 and reaching an all-time peak of $41.77 per person today. Should we be concerned? While per person levels of consumer debt are concerning, consumer debt to GDP levels would tell a different story. Dividing the same total nominal consumer debt as shown in the chart by nominal U.S. GDP, we have 0.6x in 2003, 0.9x in 2008, 0.7x in 2013 and back to 0.6x today.

The two leverage ratios suggest opposing conclusions. While the per person leverage ratio is showing that we are worse off today than in 2008, the GDP leverage ratio is showing that we are just fine, with a consumer debt-to-GDP ratio that is nowhere near 2008 and more akin to 2003. Bottom line, this is telling us that our GDP is growing at a faster rate than our population, due at least in part to advances in technology that have raised productivity levels. However, the per person leverage ratio is showing that each American on average now has more debt than ever before, even more than 2008 levels, which bears watching for its potential impact on overall growth in the coming years.

Print PDF > Are Americans Swimming in Debt Again?

The opinions expressed herein are those of Marquette Associates, Inc. (“Marquette”), and are subject to change without notice. This material is not financial advice or an offer to purchase or sell any product. Marquette reserves the right to modify its current investment strategies and techniques based on changing market dynamics or client needs.

When the Experts Are Wrong

Since the end of October, the yield on the 10-year Treasury fell more than 1% and as of writing stands at 2.12%. The drop resulted in the yield curve inverting between the 3-month and 10-year maturities, and the 2-year yield is getting dangerously close to also surpassing the 10-year. This dramatic decline and inversion made investors nervous that a recession was on the horizon and caught most economists off-guard. In both 4Q and 1Q the 10-year yield ended lower than the average forecast from the Bloomberg consensus by about 0.4%. 2Q is on track to be even worse as the yield may fall below the forecasted low from the survey.

Towards the end of 2018, most believed the 10-year would rise thanks to continued growth and further rate hikes by the Fed. However, volatility and ongoing concerns about tariffs have pushed investors into safe-haven assets. This was further fueled by the weaker than expected job reports and most now believe the Fed will likely cut interest rates at least once before the end of the year. As a result, some institutions revised their forecasts for the remainder of 2019, going as low as 1.75% for the 10-year. That said, there is still a great deal of uncertainty and rates could just as easily rebound should we get more positive economic data, if the Fed chooses not to decrease rates, or if there is a resolution to the trade conflict. Overall, this serves as a reminder to investors that timing the market is an imperfect science and even experts can miss the mark by a wide margin. We continue to encourage clients to stick to their investment policies, invest for the long-term, and follow a disciplined rebalancing routine.

Print PDF > When the Experts Are Wrong

The opinions expressed herein are those of Marquette Associates, Inc. (“Marquette”), and are subject to change without notice. This material is not financial advice or an offer to purchase or sell any product. Marquette reserves the right to modify its current investment strategies and techniques based on changing market dynamics or client needs.

Tank on Empty? Proposed Tariffs on Mexico Will Heavily Impact the Auto Industry

On May 30th, President Trump announced via Twitter that the United States will impose a 5% tariff on all Mexican imports starting on June 10th. The White House added that this percentage could quickly escalate to 25% if Mexico fails to “reduce the number of illegal aliens” crossing border lines. This week’s chart displays the potential impact of these tariffs on the auto industry in both the United States and Mexico.

In the first quarter of 2019, the United States’ imports of motor vehicles and parts totaled $93.3B (bar chart). Out of this total, the United States imported a whopping $32.8B from Mexico, almost a third of all the United States’ imports in motor vehicles and parts. After Trump’s tweet, both the S&P 500 Index and the S&P 500 Consumer Discretionary sector fell sharply.

Looking at specific auto stocks (line chart), General Motors (GM) will likely struggle dealing with this tariff as GM is Mexico’s largest automaker and has 14 manufacturing plants located throughout the country. Ford could also struggle: approximately 10% of Ford’s vehicles sold in the United States last year were imported from Mexico. Overall, these tariffs are likely to raise auto prices and reduce profits of automakers, which is bad news for investors and consumers.

Print PDF > Tank on Empty? Proposed Tariffs on Mexico Will Heavily Impact the Auto Industry

The opinions expressed herein are those of Marquette Associates, Inc. (“Marquette”), and are subject to change without notice. This material is not financial advice or an offer to purchase or sell any product. Marquette reserves the right to modify its current investment strategies and techniques based on changing market dynamics or client needs.

Sell in May and Go Away?

Global equity markets declined in May on a flurry of geopolitical news. As tensions persist, stocks are grasping to sustain their former rocket-like pace.

This newsletter details the recent trade and tariff announcements, their impact on the markets, and a look at what to expect in the remaining months of 2019.

Read > Sell in May and Go Away?

The opinions expressed herein are those of Marquette Associates, Inc. (“Marquette”), and are subject to change without notice. This material is not financial advice or an offer to purchase or sell any product. Marquette reserves the right to modify its current investment strategies and techniques based on changing market dynamics or client needs.

Has Supply Peaked for this Real Estate Cycle?

Deliveries of new supply (property stock) in the commercial real estate market appear to have peaked in 2018 across all major property sectors (apartment, industrial, office, and retail). Higher construction and labor costs, as well as positive net absorption (demand), particularly in the apartment sector, are keeping supply in check. These supply dynamics give us comfort that the next real estate slowdown will be less severe compared to the last two cycles when oversupply prior to a recession exacerbated the downturn.

Despite further moderation in returns, overall fundamentals (absorption, occupancy, fund flows) remain relatively healthy across the real estate sector. Real estate lenders are more risk aware and showing heightened levels of discipline in this cycle compared to the last cycle. Strong fundamentals coupled with tightened lender behavior and little to no expected interest rate increases in 2019 should lead to stable real estate pricing and cap rate spreads to U.S. Treasury yields. As a result, we expect total returns in the mid-single digits for core real estate with an emphasis on income growth (NOI) over appreciation.

Print PDF > Has Supply Peaked for this Real Estate Cycle?

The opinions expressed herein are those of Marquette Associates, Inc. (“Marquette”), and are subject to change without notice. This material is not financial advice or an offer to purchase or sell any product. Marquette reserves the right to modify its current investment strategies and techniques based on changing market dynamics or client needs.

Upping the Trade Ante: The U.S. Increases Tariffs on China

On May 10th, the United States increased tariffs from 10% to 25% on $200 billion of Chinese imports after trade talks broke down. The increase was initially planned for January 1, 2019, but the U.S. delayed the tariffs in order to see if a resolution could be reached by May 1st. China retaliated on May 13th with an increase in tariffs on $60 billion on American goods, effective June 1st.

Since the announcement, U.S. and Chinese equity markets have been down 0.9% and 6.1% through May 17th. In particular, there are a number of companies and industries caught in trade crosshairs:

  • Apple: China accounts for almost 20% of Apple’s revenue and hundreds of its suppliers are located in China. Concurrently, Chinese consumers have been moving away from more expensive iPhones towards cheaper Chinese brands like Huawei.
  • Semiconductors: Intellectual property disputes were key to the breakdown in trade negotiations. Many semiconductors are made in China and are used in mobile devices. An increase in tariffs could raise prices for consumers, which may lead to higher inventories and lower investment in innovation.
  • Materials: China owns 90% of rare earth supplies, which are used in advanced technologies. These materials may be subject to future tariffs.

Fortunately, the United States has taken some steps to lessen the blow of tariffs. First, the Trump administration delayed making a final decision on whether to impose tariffs on auto imports from the European Union and Japan. Second, the administration reached a deal with Canada and Mexico to end U.S. and retaliatory tariffs on steel and aluminum. This removes a major roadblock in the possible passage of the USMCA trade agreement, which would replace NAFTA, by Congress. However, our trade with China is greater than our trade with Canada or Mexico.

Recently, consumer confidence hit a 15-year high, but the survey was taken before the May 8th trade announcement. While the Street is crossing its fingers that a deal can be reached by the G20 summit in late June, we are more concerned with how a prolonged dispute can affect business investment and eventually, consumer confidence.

Print PDF > Upping the Trade Ante: The U.S. Increases Tariffs on China

The opinions expressed herein are those of Marquette Associates, Inc. (“Marquette”), and are subject to change without notice. This material is not financial advice or an offer to purchase or sell any product. Marquette reserves the right to modify its current investment strategies and techniques based on changing market dynamics or client needs.