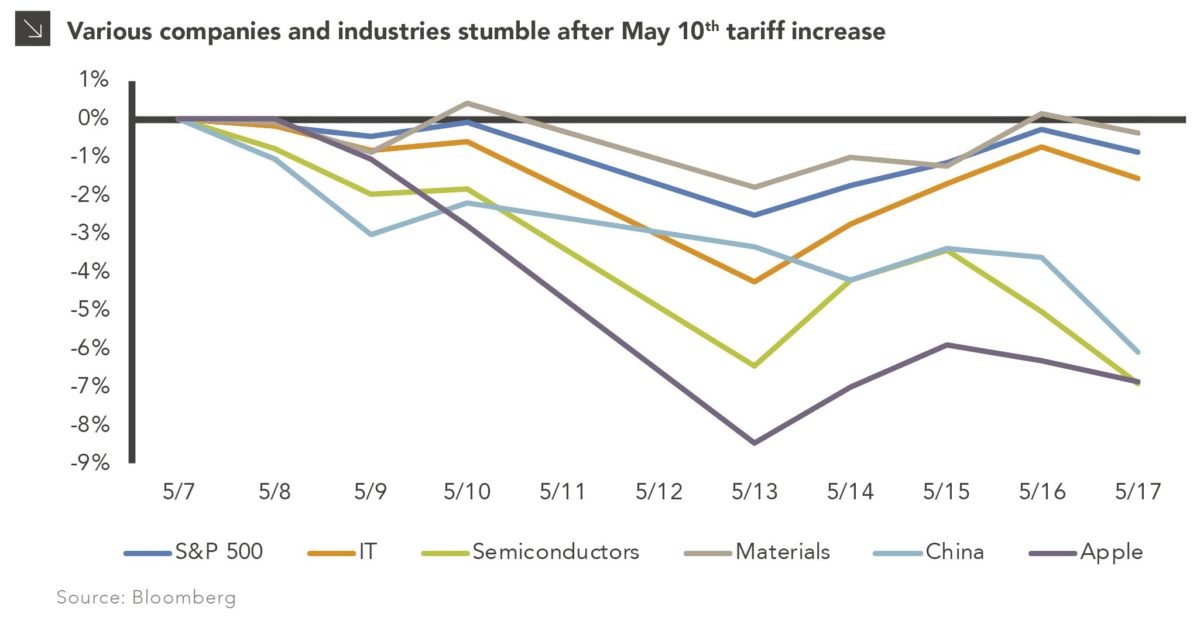
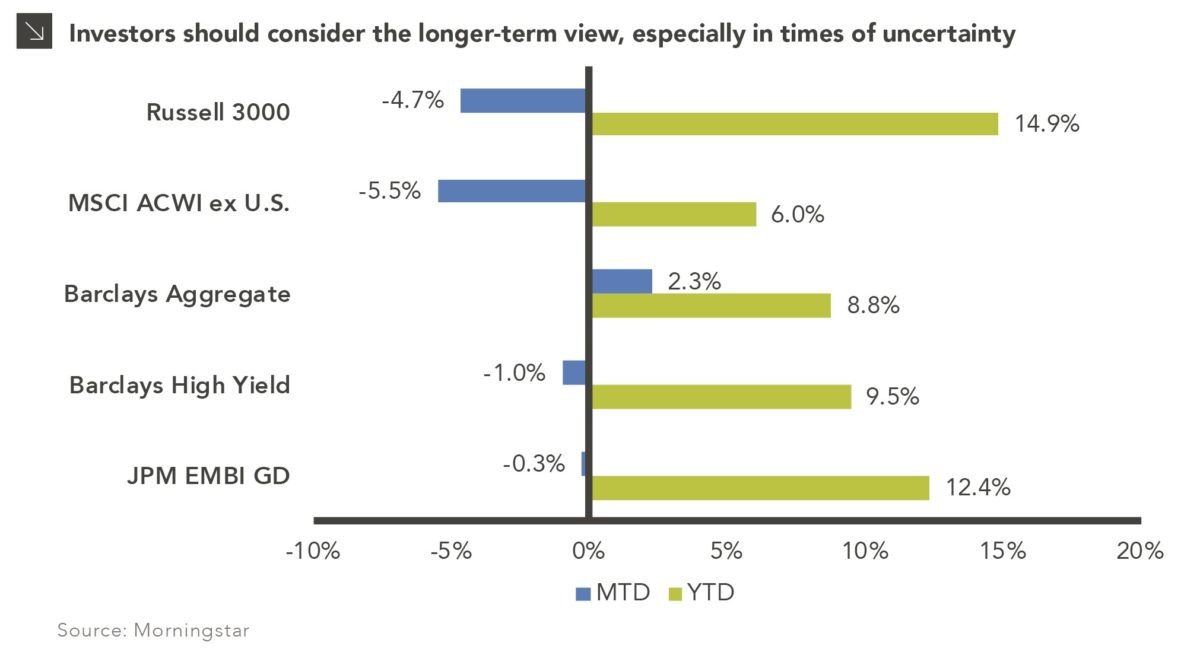
August Off to a Difficult Start

Since peaking late in the third quarter of 2018, U.S. equities have experienced large swings in performance. Following the worst December performance since 1931, the S&P 500 staged a dramatic rebound logging its best quarterly return since the first quarter of 1998. Equities continued their march higher culminating with the S&P 500 reaching an all-time closing high of 3,025.86 on Friday, July 26th. The year-to-date rally is attributable to a multitude of factors, however, a dovish pivot by the Fed and optimism around U.S.-China trade relations were key macro drivers facilitating the rebound.

However, fortunes quickly changed last week as the S&P 500 logged its worst weekly performance so far this year with a 3.1% drop and the sell-off continued into Monday with a steep one-day drop of 3%. Recent market volatility centers around changing expectations with respect to the economic outlook, market participants reconciling a smaller rate cut than was priced in, and an escalation in the trade war with China. U.S. officials had hinted throughout the year that a deal was close ­— and progress was being made — however that trade deal optimism is now in doubt. An additional 10% tariff on $300 billion worth of Chinese goods was announced last week and is set to take effect on September 1st. China retaliated by telling its state-owned companies to suspend U.S. agricultural imports and allowing its currency to fall to decade lows against the U.S. dollar.

Volatility is likely to stay elevated over the near-term as the economic and trade outlooks remain uncertain. Historically, August is a volatile month and on average the third quarter produces muted returns. It is worth noting that the S&P 500 still has a double-digit year-to-date return and is trading nearly 5% below all-time highs; whether or not the index remains in positive territory for the duration of 2019 will no doubt depend at least partly on how the U.S.-China trade issues play out over the next 5 months.

Print PDF > August Off to a Difficult Start

The opinions expressed herein are those of Marquette Associates, Inc. (“Marquette”), and are subject to change without notice. This material is not financial advice or an offer to purchase or sell any product. Marquette reserves the right to modify its current investment strategies and techniques based on changing market dynamics or client needs.

Second Quarter Review of Asset Allocation: Risks and Opportunities

Overall, the second quarter was positive for financial markets, thanks to strong economic fundamentals and expected Fed stimulus. Unemployment remains low at 3.7% and inflation (1.8% year over year) is near the Fed’s long-term target of 2%. However, there are increasing concerns about a global economic slowdown and early forecasts for 2Q GDP growth are around 1.5%, far lower than what we’ve seen in recent quarters. Globally, the most important trends we see are the following:

  • The U.S.-China trade conflict remains ongoing as talks between the two countries resumed, but little progress has been made;
  • The Federal Reserve is expected to cut rates in July and markets are forecasting another one to two cuts by the end of the year;
  • Business sentiment is declining ­— most notably in the PMI manufacturing index, which is now dangerously close to falling below its growth threshold;
  • Britain continues to struggle with its Brexit and elected a new PM (Boris Johnson) on July 23rd;
  • China and Europe are expected in increase their stimulus measures to combat slow growth and overall global uncertainty;
  • Late-cycle dynamics in credit and equity markets.

The impact of these trends is explored further in this newsletter as we review second-quarter performance and expectations going forward for each of the major asset classes.

Read > Second Quarter Review of Asset Allocation: Risks and Opportunities

The opinions expressed herein are those of Marquette Associates, Inc. (“Marquette”), and are subject to change without notice. This material is not financial advice or an offer to purchase or sell any product. Marquette reserves the right to modify its current investment strategies and techniques based on changing market dynamics or client needs.

Russell Indices Incorporate “Uber” Exciting IPOs

It’s that time of year again! The end of June brings longer summer days and the annual Russell index reconstitution. The Russell 1000’s constituent rebalancing this month also brings the inclusion of a few recent high-profile IPOs, most notably Uber, Lyft, Spotify, and Beyond Meat. This means all investors holding a passive allocation to the Russell 1000 will soon hold shares in these companies.

The Russell’s methodology weights constituent allocations based on the free-float market cap, which only includes shares readily available to trade. We show here estimated weightings of these newly IPO’d constituents alongside some well-known peers of similar weights. Notably, Microsoft has overtaken Apple as the largest index constituent. Uber, while likely the largest IPO of 2019, is still dwarfed by these two behemoths and will ultimately not become a massive component of the index’s roughly 1,000 constituents. Similarly, while the top few constituents seem to hold outsized portions of the index, the index’s performance is not dictated solely by them as they are significantly outnumbered by over 900 names which contribute to performance.

Print PDF > Russell Indices Incorporate “Uber” Exciting IPOs

The opinions expressed herein are those of Marquette Associates, Inc. (“Marquette”), and are subject to change without notice. This material is not financial advice or an offer to purchase or sell any product. Marquette reserves the right to modify its current investment strategies and techniques based on changing market dynamics or client needs.

Tank on Empty? Proposed Tariffs on Mexico Will Heavily Impact the Auto Industry

On May 30th, President Trump announced via Twitter that the United States will impose a 5% tariff on all Mexican imports starting on June 10th. The White House added that this percentage could quickly escalate to 25% if Mexico fails to “reduce the number of illegal aliens” crossing border lines. This week’s chart displays the potential impact of these tariffs on the auto industry in both the United States and Mexico.

In the first quarter of 2019, the United States’ imports of motor vehicles and parts totaled $93.3B (bar chart). Out of this total, the United States imported a whopping $32.8B from Mexico, almost a third of all the United States’ imports in motor vehicles and parts. After Trump’s tweet, both the S&P 500 Index and the S&P 500 Consumer Discretionary sector fell sharply.

Looking at specific auto stocks (line chart), General Motors (GM) will likely struggle dealing with this tariff as GM is Mexico’s largest automaker and has 14 manufacturing plants located throughout the country. Ford could also struggle: approximately 10% of Ford’s vehicles sold in the United States last year were imported from Mexico. Overall, these tariffs are likely to raise auto prices and reduce profits of automakers, which is bad news for investors and consumers.

Print PDF > Tank on Empty? Proposed Tariffs on Mexico Will Heavily Impact the Auto Industry

The opinions expressed herein are those of Marquette Associates, Inc. (“Marquette”), and are subject to change without notice. This material is not financial advice or an offer to purchase or sell any product. Marquette reserves the right to modify its current investment strategies and techniques based on changing market dynamics or client needs.

Sell in May and Go Away?

Global equity markets declined in May on a flurry of geopolitical news. As tensions persist, stocks are grasping to sustain their former rocket-like pace.

This newsletter details the recent trade and tariff announcements, their impact on the markets, and a look at what to expect in the remaining months of 2019.

Read > Sell in May and Go Away?

The opinions expressed herein are those of Marquette Associates, Inc. (“Marquette”), and are subject to change without notice. This material is not financial advice or an offer to purchase or sell any product. Marquette reserves the right to modify its current investment strategies and techniques based on changing market dynamics or client needs.

Upping the Trade Ante: The U.S. Increases Tariffs on China

On May 10th, the United States increased tariffs from 10% to 25% on $200 billion of Chinese imports after trade talks broke down. The increase was initially planned for January 1, 2019, but the U.S. delayed the tariffs in order to see if a resolution could be reached by May 1st. China retaliated on May 13th with an increase in tariffs on $60 billion on American goods, effective June 1st.

Since the announcement, U.S. and Chinese equity markets have been down 0.9% and 6.1% through May 17th. In particular, there are a number of companies and industries caught in trade crosshairs:

  • Apple: China accounts for almost 20% of Apple’s revenue and hundreds of its suppliers are located in China. Concurrently, Chinese consumers have been moving away from more expensive iPhones towards cheaper Chinese brands like Huawei.
  • Semiconductors: Intellectual property disputes were key to the breakdown in trade negotiations. Many semiconductors are made in China and are used in mobile devices. An increase in tariffs could raise prices for consumers, which may lead to higher inventories and lower investment in innovation.
  • Materials: China owns 90% of rare earth supplies, which are used in advanced technologies. These materials may be subject to future tariffs.

Fortunately, the United States has taken some steps to lessen the blow of tariffs. First, the Trump administration delayed making a final decision on whether to impose tariffs on auto imports from the European Union and Japan. Second, the administration reached a deal with Canada and Mexico to end U.S. and retaliatory tariffs on steel and aluminum. This removes a major roadblock in the possible passage of the USMCA trade agreement, which would replace NAFTA, by Congress. However, our trade with China is greater than our trade with Canada or Mexico.

Recently, consumer confidence hit a 15-year high, but the survey was taken before the May 8th trade announcement. While the Street is crossing its fingers that a deal can be reached by the G20 summit in late June, we are more concerned with how a prolonged dispute can affect business investment and eventually, consumer confidence.

Print PDF > Upping the Trade Ante: The U.S. Increases Tariffs on China

The opinions expressed herein are those of Marquette Associates, Inc. (“Marquette”), and are subject to change without notice. This material is not financial advice or an offer to purchase or sell any product. Marquette reserves the right to modify its current investment strategies and techniques based on changing market dynamics or client needs.

U.S. Equities Rally as Outflows Persist

This week’s chart looks at Morningstar fund flow data among the broad category groups of U.S. equity, international equity, taxable bond, and municipal bond. Since January 2018, U.S. equity funds saw cumulative net outflows totaling $123 billion, while international equities had positive cumulative inflows of $30 billion, taxable bonds had positive cumulative inflows of $97 billion, and municipal bonds had positive cumulative inflows of $32 billion. Negative fund flows within U.S. equities continue to persist in 2019 despite strong year-to-date gains.

The trend of U.S. equity outflows over the span of this bull market is nothing new but it is surprising to see fund outflows persist in the face of such a strong recovery off the December 2018 lows. As an example, the S&P 500 recently hit a record closing high of 2,945.83 on April 30th, surpassing the previous record closing high of 2,930.75 logged on September 20th, 2018. With the bull market turning ten years old on March 9th, a non-euphoric sentiment among investors may be a factor keeping this historically long bull market going.

What is driving this recent rally? In the past few months, investors have reacted to a significant reversal in monetary policy, better than expected first quarter earnings, a strong first quarter GDP, as well as continued increases in corporate stock buybacks. However, caution observed in fund flows may prove warranted with such items as a technical yield curve inversion, weakening profit margins, U.S.-China trade deal, Brexit, and upcoming 2020 elections weighing on investors’ minds.

Print PDF > U.S. Equities Rally as Outflows Persist

The opinions expressed herein are those of Marquette Associates, Inc. (“Marquette”), and are subject to change without notice. This material is not financial advice or an offer to purchase or sell any product. Marquette reserves the right to modify its current investment strategies and techniques based on changing market dynamics or client needs.

First Quarter Review of Asset Allocation

Heading into 2019, the primary risks facing financial markets were the trade war with China, the U.S. government shutdown, Brexit uncertainty, and further Fed rate hikes. However, in the first quarter the majority of these worries subsided.

In this newsletter, we analyze the current market environment with a review of recent performance and future expectations for each major asset class. As always, we caution investors to stay diversified and rebalance as appropriate. There are always potential disruptors to the financial markets and the most powerful tend to be largely unexpected. We will continue to monitor markets and developments as they occur to guide our clients to the most optimal portfolio decisions given the backdrop of program goals and risk tolerance.

Read > First Quarter Review of Asset Allocation

The opinions expressed herein are those of Marquette Associates, Inc. (“Marquette”), and are subject to change without notice. This material is not financial advice or an offer to purchase or sell any product. Marquette reserves the right to modify its current investment strategies and techniques based on changing market dynamics or client needs.

Should Investors Reduce Equity Allocations After Yield Curve Inversion?

The yield curve plots the relationship between U.S. bond yields and their maturities, and typically slopes upward: the longer you hold the security, the higher the return given various risks through time such as inflation, opportunity cost, and economic uncertainty. The yield curve, however, can be inverted when high demand for long-term Treasuries drives the price up and the yield down resulting in a downward sloping curve. Yield curve inversion often signals a pessimistic view of the economy in which investors look for protection against slow economic growth and higher-than-expected inflation. Furthermore, the previous four instances of curve inversion have been followed by a market correction, though it can sometimes be years before a market correction follows inversion.

Last Friday, the 10-year Treasury yield fell below short-term yields with maturities ranging from 1-month to 1-year in response to disappointing Eurozone data, geopolitical risks around Brexit, and Fed Chairman Jerome Powell’s remark on a global economic slowdown. Shortly after the yield curve inverted — especially after the negative yield spread emerged between 3-month and 10-year Treasuries (regarded as the Fed’s most sensitive measure of market sentiment) — the equity market sold off and the S&P 500 total return fell by 1.89%. This immediate reaction led some investors to believe the correction was already unfolding.

While it is impossible to determine at this point if the correction is already here, investors should take comfort knowing that the equity market eventually rebounds from these corrections and shows resilience after the yield curve inverts. Our chart above shows the subsequent 3-month, 6-month, 1-year, 2-year, and 5-year returns of the S&P 500 index after the primary inversion data point — the spread between the 2-year and 10-year Treasury yields — first went negative (thus inverting). For example, after the 10s/2s yield inversion on December 27, 2005, S&P 500 annualized total returns after 1 year, 2 years and 5 years were 15.6%, 10.7% and 2.2% respectively. Over longer time periods after yield curve inversion, such as 7 or 10 years, equity returns more closely resemble their long-term averages. The other primary takeaway from the chart is that shorter-term equity returns — 3, 6, or 12 months — feature significant disparity from the last four yield curve inversions, indicating each instance is different in terms of magnitude and timing after initial 10s/2s inversion. Thus, we do not recommend that investors reduce their equity allocations in an attempt to time the potential correction after inversion, and over the longer-term, equities are still expected to be positive contributors to portfolio returns, even if the yield curve is temporarily inverted.

Print PDF> Should Investors Reduce Equity Allocations After Yield Curve Inversion?

The opinions expressed herein are those of Marquette Associates, Inc. (“Marquette”), and are subject to change without notice. This material is not financial advice or an offer to purchase or sell any product. Marquette reserves the right to modify its current investment strategies and techniques based on changing market dynamics or client needs.

ESG Assets Continue Their Dramatic Rise

The demand for — and supply of — ESG investment opportunities has surged over the past several years. This week’s chart depicts the rise in U.S. based ESG assets. After doubling in size between 2012 and 2016, the value of sustainable, responsible and impact investing assets grew by another 38% from 2016 to 2018. These investments now account for more than ¼th of total U.S. assets under professional management.

From the demand side, signatories to the Principles for Responsible Investment, a set of investment principles that enables the incorporation of ESG considerations into investment practices, grew in combined assets from less than $6 trillion in 2006 to over $81 trillion by the end of April 2018. In response, the supply of ESG strategies in the market continues to increase as well, with investment firms offering ESG products in both the traditional and alternative asset classes.

Regulatory changes, new research, and shifting investor demographics continue to foster increased interest in ESG investing, and plan sponsors should be prepared to adapt their investment options to accommodate the changing landscape.

Print PDF> ESG Assets Continue Their Dramatic Rise

The opinions expressed herein are those of Marquette Associates, Inc. (“Marquette”), and are subject to change without notice. This material is not financial advice or an offer to purchase or sell any product. Marquette reserves the right to modify its current investment strategies and techniques based on changing market dynamics or client needs.