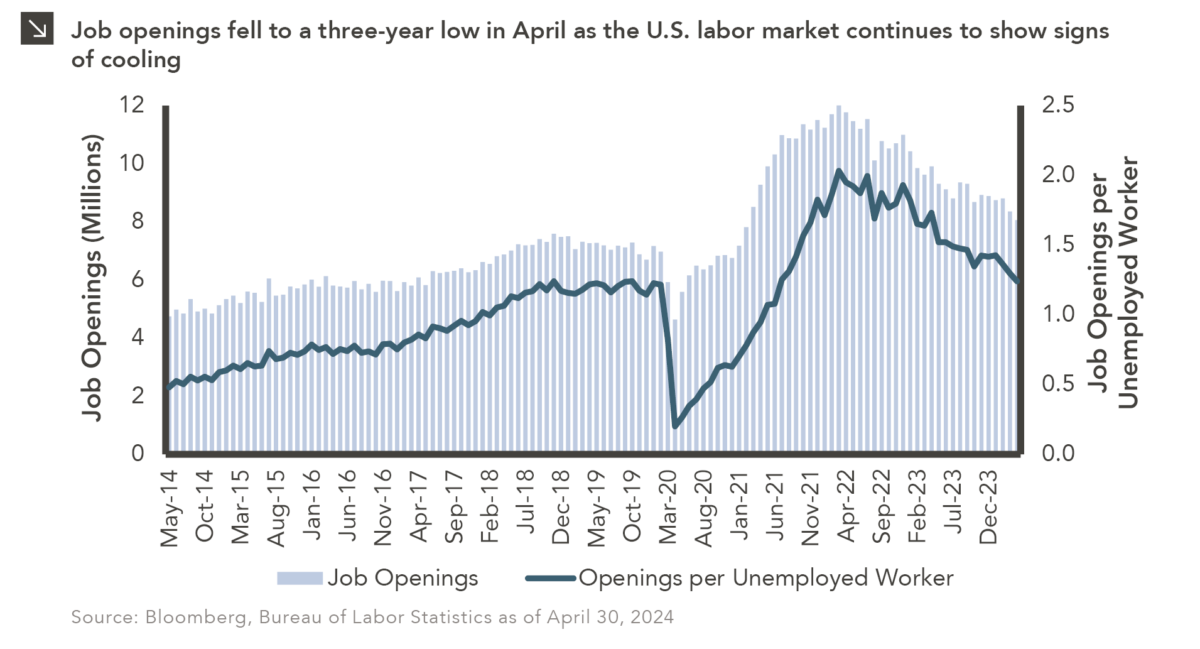
Is Bitcoin Fairly Valued?

Despite mixed performance to start 2024, bitcoin finished the first quarter up roughly 68%. Buoyed by a broad weakening of foreign currencies, persistent inflationary pressures, and the January launch of almost a dozen U.S. spot-based ETFs, an extended February rally drove bitcoin’s market value to several all-time highs, peaking around $73,000 in mid-March. In the face of a relatively remarkable ascension, observers may find themselves wondering if bitcoin’s recent values are fundamentally justified or if they are simply the latest bout of speculative frenzy.

Before delving in, it’s crucial to understand the distinction between market values and fair values. Market values are the day-to-day prices of an asset that tend to fluctuate due to a dynamic interplay of supply, demand, immediate market conditions, and investor behavior. Fair values, on the other hand, represent the intrinsic worth of an asset based on its underlying economic fundamentals. In the context of a currency, inflation rates provide insight into current and future purchasing power, while yields help assess the potential attractiveness and risk of an investment. By analyzing the relative differences in these factors for a currency pair at a given point in time, investors can gauge whether a currency is relatively overvalued or undervalued.

While it is debatable whether bitcoin can be truly be labeled as a currency, we approach this analysis with that presumption, and readily recognize that the infancy of bitcoin and the broader cryptocurrency market lends itself to a wide measure of valuation methods. That said, illustrated above in blue is the discounted value of bitcoin, flanked by its implied fair value range in light teal.¹ Since currencies are free-floating and often subjected to speculative short-term shocks, and because rate environments can shift relatively quickly, fair value ranges tend to be more useful for analysis than a single point-in-time value. As such, the fair value range highlighted in teal reflects the historical variance of discounted values. Critically, the spot price of bitcoin consistently falls within the fair values computed by the model, which allows us to assess today’s price versus the range computed by our model.

So, is bitcoin overvalued or undervalued? Based on the ranges and values implied by the terminal discounted cash flow method, bitcoin appears to have closed the first quarter at elevated levels and moderated near its discounted fair value in April. It is important to reiterate several points. The discounted cash flow method used in this analysis is one of several potential methods for valuation, and other conclusions will likely vary. Floating currency and cryptocurrency valuations are dynamic, constantly shifting with inflation, real yields, and other factors. The fair values illustrated above are exclusive to the U.S. dollar and bitcoin; their bearing on the relative valuations of other currencies has not been expressed or implied. This point-in-time analysis should not be interpreted as forward-looking as past performance trends do not guarantee future results. Ultimately, this is one take on analyzing the price of bitcoin within a historical context and an eye on forward price behavior. Future price behavior will provide further opportunities to validate this approach to pricing.

¹The discounted terminal values of bitcoin are based on a discounted cashflow model that incorporates U.S. Treasury rates and bitcoin mining rewards with an imputed risk premium. 

1Q 2024 Market Insights Video

This video is a recording of a live webinar held April 25 by Marquette’s research team analyzing the first quarter of 2024 across the economy and various asset classes and themes we’ll be monitoring in the coming months.

Our quarterly Market Insights series examines the primary asset classes we cover for clients including the U.S. economy, fixed income, U.S. and non-U.S. equities, hedge funds, real assets, and private markets, with commentary by our research analysts and directors.

Sign up for research alerts to be invited to future webinars and notified when we publish new videos. If you have any questions, please send us an email.

Mind the Gap

Any ride on the London Tube reminds riders to mind the gap: Beware the space between train car and platform as you board and depart the train. A recent trip to London brought this phrase back to me and it seemed like a perfect description of how to look at financial markets this year, with the “gap” serving as the difference between expectations and reality, most particularly in terms of interest rate cuts.

In our market preview, we identified the Fed pivot as a primary driver of financial markets this year, most especially how expectations of cuts would line up with actual Fed policy. Going into the year, the market had priced in at least five cuts, which helped fuel a furious fourth quarter rally and investor optimism for 2024. One quarter in, however, those expectations have been turned on their head. Hotter than expected inflation and jobs reports in March have created a “higher for longer” narrative with the market expecting no more than two cuts during the second half of the year. Some economists have taken an even more bearish stance, suggesting there will not be any cuts. Overall, rates rose across the curve during the quarter as current U.S. debt levels sustained the long end of the curve while the short end was relatively unmoved.

Intuitively, many investors would expect such a big change in rate expectations to weigh heavily on markets, both equities and bonds. In that sense, equity performance was surprising during the first quarter, as the upward trend from 2023 continued. Predictably, bonds suffered as rates rose, but below investment grade sectors were profitable. To be fair, though, it should be noted that equities have endured a difficult start to this month, down 4.6% through April 22 as the higher for longer narrative has gained momentum.¹

Going forward, what should we watch for from asset classes as we venture into a market environment that looks much different than what we were expecting only three months ago?

Japan: This Year’s Vacation Recommendation

Foreign investment isn’t the only thing streaming into Japan. In 2023, the number of travelers to the country surpassed long-term average levels, though that figure still sat below pre-pandemic highs. That said, last year was a clear sign of recovery for Japan’s beleaguered tourism industry, and this trend has continued into 2024. Through the first two months of this year, the number of visitors to Japan is already close to 22% of last year’s total, with tourists coming from surrounding Asian countries and the Western world as well. To that point, nearly 150,000 U.S. citizens visited Japan in the month of February alone. A major driver of Japan’s appeal to tourists is the weak yen. In April, the yen hit a low not seen in over 30 years relative to the dollar, thanks in part to disparity between the policies of the Federal Reserve and the Bank of Japan. These dynamics have allowed U.S. travelers to enjoy more “bang for their buck.”

Earlier this year, Japan slightly curtailed its long-running accommodative monetary policy with the goal of addressing the country’s chronic deflation problem and spurring economic growth. The influx of tourists described above might also provide these desired effects, with several industries, including transportation, restaurants, entertainment, and hospitality potentially standing to benefit. For instance, there has been a material increase in average daily hotel rates in Japan, which recently hit highs not seen since the late 1990s. Although this is just one example of travelers having an impact on Japanese price levels and growth, it is illustrative of what could happen more broadly to industries directly tied to tourism. While the outlook for economic growth and future tourism in Japan is uncertain, it is encouraging to see certain data reflect the pre-pandemic environment.

The Banks’ Real Estate Problem

First quarter earnings season is getting started, with the largest banks reporting first. In the wake of last year’s regional banking crisis and the potential new normal of higher-for-longer interest rates, all eyes are on the health of the U.S. financial system. With commercial real estate (CRE) still searching for its bottom, losses related to CRE exposures are of particular concern for the banking industry. There is $5.7 trillion in commercial real estate debt outstanding and small to mid-size banks hold a disproportionate amount of it, putting the group at higher risk. Regional lender New York Community Bancorp (NYCB) — with the fifth largest concentration of CRE loans, as shown above — garnered headlines earlier this year after reporting a sizeable fourth quarter loss and disclosing material weakness in the way it reviewed its loan portfolio, prompting a $1 billion emergency investment. While NYCB’s outsized exposure to rent-controlled multi-family property loans may limit contagion to the broader banking sector, risks remain. As consumers respond to the higher rate environment, bank funding costs increase, eating into the higher lending profits the sector has enjoyed. Combined with losses and provisions tied to the troubled real estate sector, banks may limit lending, which flows through to the consumer and economy. As the macro backdrop remains in flux and the consumer continues to adjust to a higher-for-longer environment, any bank weakness could become more of a threat and bears watching as earnings season continues.

First to Cut: The Fed or the ECB?

Based on implied probabilities derived from options markets, investors are currently forecasting an 82% chance that the European Central Bank will cut its policy rate at or before its June meeting. For the full year, market participants currently expect roughly three rate cuts by the ECB in total. By comparison, investors believe there is only a 46% chance the Federal Reserve will lower its policy rate in or before June and are now expecting fewer than two rate cuts from the U.S. central bank over the course of the full year.

Some of the primary reasons for these expectations involve both economic growth and inflation. To that point, in the fourth quarter of 2023, the U.S. economy grew 5.9% on a year-over-year basis. This is in stark contrast to the euro area, which produced 0.0% year-over-year growth for that same period. Estimates for first quarter GDP growth tell a similar story in terms of divergence between the two regions, as the U.S. economy continues to perform well due to a strong labor market and a resilient domestic consumer. On the inflation front, both regions have seen price levels fall from peaks seen in 2022, though European inflation has proved less sticky than that of the U.S. Specifically, the March reading for domestic CPI was 3.5%, which came in above both consensus expectations and the 2.4% figure for the euro area. In short, as it relates to monetary policy expectations, lower levels of economic growth call for more supportive monetary policy, and lower levels of inflation allow for such policy. Should current forecasts related to the trajectory of interest rates come to fruition, the U.S. dollar is likely to benefit relative to the euro, which may create a short-term headwind for non-U.S. equity returns. However, more accommodative monetary policy by the ECB may also serve as a medium-term tailwind for international stocks should the move result in stronger economic growth for the European continent.

Sweet and High Up

Chocolate eggs and bunnies may have appeared more expensive to shoppers this Easter weekend, as the price of cocoa futures has surged by around 125% since the beginning of 2024. New York futures prices saw a roughly 50% increase in the month of March alone and now sit at an all-time high of just below $10,000 per metric ton. By comparison, copper futures prices sat at approximately $8,900 per metric ton as of this writing, meaning cocoa is currently more expensive than the bellwether industrial metal.

The drivers of this dramatic increase in cocoa prices involve difficulties faced by the two biggest growers of the commodity: Ivory Coast and Ghana. Specifically, both nations have seen production hampered by strong seasonal winds and a lack of rainfall, as well as a prevalent disease known as swollen shoot virus, which serves to kill cocoa trees and leads to a drop in yields. To make matters worse, the Ghana Cocoa Board, which depends on foreign financing to compensate domestic farmers, may soon lose access to a critical funding facility due to a lack of beans. Due to these challenges, experts currently expect cocoa production shortfalls ranging from 150,000 to 500,000 tons over the next few seasons.

As readers might imagine, these dynamics are creating turmoil within futures markets. Investors with short positions have been forced to either manage margin calls or purchase contracts to close out their shorts, which can exacerbate price action. Pain has not been limited to futures market participants, as consumers have been forced to stomach chocolate prices that have climbed by roughly 10% over the last year. Additionally, it is possible that more shelf price increases are on the way, as producers of chocolate often hedge their purchases of cocoa months in advance. All of this said, it is unlikely that these developments will have a material impact on capital markets broadly. In other words, a diversified portfolio is one of the best ways for investors to keep their returns sweet!

The Crystal Ball Has Clouded

Last month, Marquette published a Chart of the Week that highlighted the aberrational length of the current Treasury curve inversion. As outlined in that publication, a Treasury curve inversion occurs when short-term rates move higher than long-term rates, and a persistent inversion has historically served as a portent of an economic recession. To that point, an inversion preceded each U.S. recession by 18 months at the longest (usually less than a year) since the 1970s. That said, while the current inversion has persisted for nearly two years (and counting), an economic downturn has yet to materialize. Put simply, this time may be different. In fact, according to a recent Reuters poll of bond market experts, nearly two-thirds of respondents opined that the shape of the yield curve no longer maintains the predictive power it once held.

What could account for this shift? There are a few possible explanations, and the first relates to the long end of the curve. Specifically, long-dated bonds, or those with maturities of 10 years or greater, have experienced a multi-decade bull run due to strong demand from pension funds and insurance companies. These entities utilize longer-dated bonds to hedge liabilities, and demand from these plans helps prevent selloffs during periods of rate weakness. These dynamics have served to keep the long end of the yield curve relatively stable in recent time. Indeed, while the effective federal funds rate has climbed by over 5% since the Fed began its hiking cycle, the 30-year Treasury yield has risen by roughly half that amount over the same period. The second possible explanation is related to shorter-dated bonds, as 2-year Treasuries are quite sensitive to Fed policy. Given recent hiking and the central bank’s commitment to holding its policy rate higher for longer, yields on 2-year notes have been pulled higher and currently sit at elevated levels.

In order for the yield curve return to normalcy, short-term yields must fall more sharply than long-term yields. However, a resilient economy will likely keep short-term rates high, and strong technical factors have likely put a cap on yields on longer-dated securities. Given this situation and the changing market dynamics outlined in the previous paragraph, the historical relationship between yield curve inversions and recessions may not hold in the current environment.

Assessing the Likelihood of a Recession and Understanding the Impact on Portfolios

Is a recession coming to the U.S.? It’s a question that has been asked since 2022, as the Fed’s rapid rate hikes sparked concern that higher interest rates would lead to demand destruction and ultimately economic contraction. Nonetheless, here we are in the first quarter of 2024 and although the growth rate of gross domestic product has fallen, it is still positive. Unemployment remains at historic lows and inflation is falling. However, with the Fed unlikely to cut rates during the first half of the year and the full effect of the higher rate environment not yet settled, the recession threat still looms over the economy and markets. Given this background, the following paper presents three reasons for each side as to whether the U.S. may enter or avoid a recession in 2024, as well as recessionary implications across asset classes.

The Dynamic Duo

In 2023, investors were stunned by the robust performance of seven prominent mega-cap stocks deemed the “Magnificent Seven.” Largely beneficiaries of the AI craze, these seven companies comprised almost 28% of the S&P 500 at the end of 2023. This narrow breadth and concentration within the market posed challenges for active large-cap managers who struggled to keep pace with benchmarks without matching the weight of this group in their portfolios. While market breadth has started to improve among large caps, a similar trend is now emerging in the small-cap universe with just two stocks, Super Micro Computers and MicroStrategy — now the two largest companies and weights in the Russell 2000, spearheading the majority of the index’s returns this year.

Since the onset of 2023, Super Micro and MicroStrategy have posted remarkable returns of 1,093% and 936%, respectively, driving up their weights in the Russell 2000 to 1.94% and 0.85%. For perspective, prior to this year, the index’s most substantial single weight since 1985 was 1.45%, at the peak of the dot-com bubble. Like the Magnificent Seven, these two firms have profited from the proliferation of AI. MicroStrategy has also capitalized on the recent cryptocurrency surge over the past six months.

While the performance of these stocks captivates attention, they have become a pain point for active small-cap managers trying to outperform the Russell 2000. Leaving aside fundamental underwriting, many small-cap managers are constrained by prudent limits on market capitalization for the companies they can invest in, and these two outsized outperformers fall far beyond those. As of March 18, Super Micro had a market cap of $55.5 billion and MicroStrategy stood at $25.3 billion, both in large-cap territory. While the Russell 2000 maintains a $6 billion market capitalization threshold for small-cap stocks, the index is only reconstituted once annually, and both companies fell within the limit in April 2023 when FTSE Russell last evaluated index characteristics. Despite their stellar performance, many managers will be unable to allocate to these companies due to their size. Though managers with prior allocations may be able to hold their positions, it could prompt scrutiny regarding the discipline of their investment approach. This predicament mimics the struggles seen in the large-cap space last year, where a select few companies drove much of the market’s performance and active manager relative weights dictated attribution. With the next Russell reconstitution not slated until June 28 of this year, active small-cap managers may have to get creative in order to navigate these challenges.