

First quarter earnings season is getting started, with the largest banks reporting first. In the wake of last year’s regional banking crisis and the potential new normal of higher-for-longer interest rates, all eyes are on the health of the U.S. financial system. With commercial real estate (CRE) still searching for its bottom, losses related to CRE exposures are of particular concern for the banking industry. There is $5.7 trillion in commercial real estate debt outstanding and small to mid-size banks hold a disproportionate amount of it, putting the group at higher risk. Regional lender New York Community Bancorp (NYCB) — with the fifth largest concentration of CRE loans, as shown above — garnered headlines earlier this year after reporting a sizeable fourth quarter loss and disclosing material weakness in the way it reviewed its loan portfolio, prompting a $1 billion emergency investment. While NYCB’s outsized exposure to rent-controlled multi-family property loans may limit contagion to the broader banking sector, risks remain. As consumers respond to the higher rate environment, bank funding costs increase, eating into the higher lending profits the sector has enjoyed. Combined with losses and provisions tied to the troubled real estate sector, banks may limit lending, which flows through to the consumer and economy. As the macro backdrop remains in flux and the consumer continues to adjust to a higher-for-longer environment, any bank weakness could become more of a threat and bears watching as earnings season continues.
Author: cvernon
First to Cut: The Fed or the ECB?

Based on implied probabilities derived from options markets, investors are currently forecasting an 82% chance that the European Central Bank will cut its policy rate at or before its June meeting. For the full year, market participants currently expect roughly three rate cuts by the ECB in total. By comparison, investors believe there is only a 46% chance the Federal Reserve will lower its policy rate in or before June and are now expecting fewer than two rate cuts from the U.S. central bank over the course of the full year.
Some of the primary reasons for these expectations involve both economic growth and inflation. To that point, in the fourth quarter of 2023, the U.S. economy grew 5.9% on a year-over-year basis. This is in stark contrast to the euro area, which produced 0.0% year-over-year growth for that same period. Estimates for first quarter GDP growth tell a similar story in terms of divergence between the two regions, as the U.S. economy continues to perform well due to a strong labor market and a resilient domestic consumer. On the inflation front, both regions have seen price levels fall from peaks seen in 2022, though European inflation has proved less sticky than that of the U.S. Specifically, the March reading for domestic CPI was 3.5%, which came in above both consensus expectations and the 2.4% figure for the euro area. In short, as it relates to monetary policy expectations, lower levels of economic growth call for more supportive monetary policy, and lower levels of inflation allow for such policy. Should current forecasts related to the trajectory of interest rates come to fruition, the U.S. dollar is likely to benefit relative to the euro, which may create a short-term headwind for non-U.S. equity returns. However, more accommodative monetary policy by the ECB may also serve as a medium-term tailwind for international stocks should the move result in stronger economic growth for the European continent.
Sweet and High Up

Chocolate eggs and bunnies may have appeared more expensive to shoppers this Easter weekend, as the price of cocoa futures has surged by around 125% since the beginning of 2024. New York futures prices saw a roughly 50% increase in the month of March alone and now sit at an all-time high of just below $10,000 per metric ton. By comparison, copper futures prices sat at approximately $8,900 per metric ton as of this writing, meaning cocoa is currently more expensive than the bellwether industrial metal.
The drivers of this dramatic increase in cocoa prices involve difficulties faced by the two biggest growers of the commodity: Ivory Coast and Ghana. Specifically, both nations have seen production hampered by strong seasonal winds and a lack of rainfall, as well as a prevalent disease known as swollen shoot virus, which serves to kill cocoa trees and leads to a drop in yields. To make matters worse, the Ghana Cocoa Board, which depends on foreign financing to compensate domestic farmers, may soon lose access to a critical funding facility due to a lack of beans. Due to these challenges, experts currently expect cocoa production shortfalls ranging from 150,000 to 500,000 tons over the next few seasons.
As readers might imagine, these dynamics are creating turmoil within futures markets. Investors with short positions have been forced to either manage margin calls or purchase contracts to close out their shorts, which can exacerbate price action. Pain has not been limited to futures market participants, as consumers have been forced to stomach chocolate prices that have climbed by roughly 10% over the last year. Additionally, it is possible that more shelf price increases are on the way, as producers of chocolate often hedge their purchases of cocoa months in advance. All of this said, it is unlikely that these developments will have a material impact on capital markets broadly. In other words, a diversified portfolio is one of the best ways for investors to keep their returns sweet!
The Crystal Ball Has Clouded

Last month, Marquette published a Chart of the Week that highlighted the aberrational length of the current Treasury curve inversion. As outlined in that publication, a Treasury curve inversion occurs when short-term rates move higher than long-term rates, and a persistent inversion has historically served as a portent of an economic recession. To that point, an inversion preceded each U.S. recession by 18 months at the longest (usually less than a year) since the 1970s. That said, while the current inversion has persisted for nearly two years (and counting), an economic downturn has yet to materialize. Put simply, this time may be different. In fact, according to a recent Reuters poll of bond market experts, nearly two-thirds of respondents opined that the shape of the yield curve no longer maintains the predictive power it once held.
What could account for this shift? There are a few possible explanations, and the first relates to the long end of the curve. Specifically, long-dated bonds, or those with maturities of 10 years or greater, have experienced a multi-decade bull run due to strong demand from pension funds and insurance companies. These entities utilize longer-dated bonds to hedge liabilities, and demand from these plans helps prevent selloffs during periods of rate weakness. These dynamics have served to keep the long end of the yield curve relatively stable in recent time. Indeed, while the effective federal funds rate has climbed by over 5% since the Fed began its hiking cycle, the 30-year Treasury yield has risen by roughly half that amount over the same period. The second possible explanation is related to shorter-dated bonds, as 2-year Treasuries are quite sensitive to Fed policy. Given recent hiking and the central bank’s commitment to holding its policy rate higher for longer, yields on 2-year notes have been pulled higher and currently sit at elevated levels.
In order for the yield curve return to normalcy, short-term yields must fall more sharply than long-term yields. However, a resilient economy will likely keep short-term rates high, and strong technical factors have likely put a cap on yields on longer-dated securities. Given this situation and the changing market dynamics outlined in the previous paragraph, the historical relationship between yield curve inversions and recessions may not hold in the current environment.
Assessing the Likelihood of a Recession and Understanding the Impact on Portfolios
Is a recession coming to the U.S.? It’s a question that has been asked since 2022, as the Fed’s rapid rate hikes sparked concern that higher interest rates would lead to demand destruction and ultimately economic contraction. Nonetheless, here we are in the first quarter of 2024 and although the growth rate of gross domestic product has fallen, it is still positive. Unemployment remains at historic lows and inflation is falling. However, with the Fed unlikely to cut rates during the first half of the year and the full effect of the higher rate environment not yet settled, the recession threat still looms over the economy and markets. Given this background, the following paper presents three reasons for each side as to whether the U.S. may enter or avoid a recession in 2024, as well as recessionary implications across asset classes.
The Dynamic Duo

In 2023, investors were stunned by the robust performance of seven prominent mega-cap stocks deemed the “Magnificent Seven.” Largely beneficiaries of the AI craze, these seven companies comprised almost 28% of the S&P 500 at the end of 2023. This narrow breadth and concentration within the market posed challenges for active large-cap managers who struggled to keep pace with benchmarks without matching the weight of this group in their portfolios. While market breadth has started to improve among large caps, a similar trend is now emerging in the small-cap universe with just two stocks, Super Micro Computers and MicroStrategy — now the two largest companies and weights in the Russell 2000, spearheading the majority of the index’s returns this year.
Since the onset of 2023, Super Micro and MicroStrategy have posted remarkable returns of 1,093% and 936%, respectively, driving up their weights in the Russell 2000 to 1.94% and 0.85%. For perspective, prior to this year, the index’s most substantial single weight since 1985 was 1.45%, at the peak of the dot-com bubble. Like the Magnificent Seven, these two firms have profited from the proliferation of AI. MicroStrategy has also capitalized on the recent cryptocurrency surge over the past six months.
While the performance of these stocks captivates attention, they have become a pain point for active small-cap managers trying to outperform the Russell 2000. Leaving aside fundamental underwriting, many small-cap managers are constrained by prudent limits on market capitalization for the companies they can invest in, and these two outsized outperformers fall far beyond those. As of March 18, Super Micro had a market cap of $55.5 billion and MicroStrategy stood at $25.3 billion, both in large-cap territory. While the Russell 2000 maintains a $6 billion market capitalization threshold for small-cap stocks, the index is only reconstituted once annually, and both companies fell within the limit in April 2023 when FTSE Russell last evaluated index characteristics. Despite their stellar performance, many managers will be unable to allocate to these companies due to their size. Though managers with prior allocations may be able to hold their positions, it could prompt scrutiny regarding the discipline of their investment approach. This predicament mimics the struggles seen in the large-cap space last year, where a select few companies drove much of the market’s performance and active manager relative weights dictated attribution. With the next Russell reconstitution not slated until June 28 of this year, active small-cap managers may have to get creative in order to navigate these challenges.
The DPI Lie?
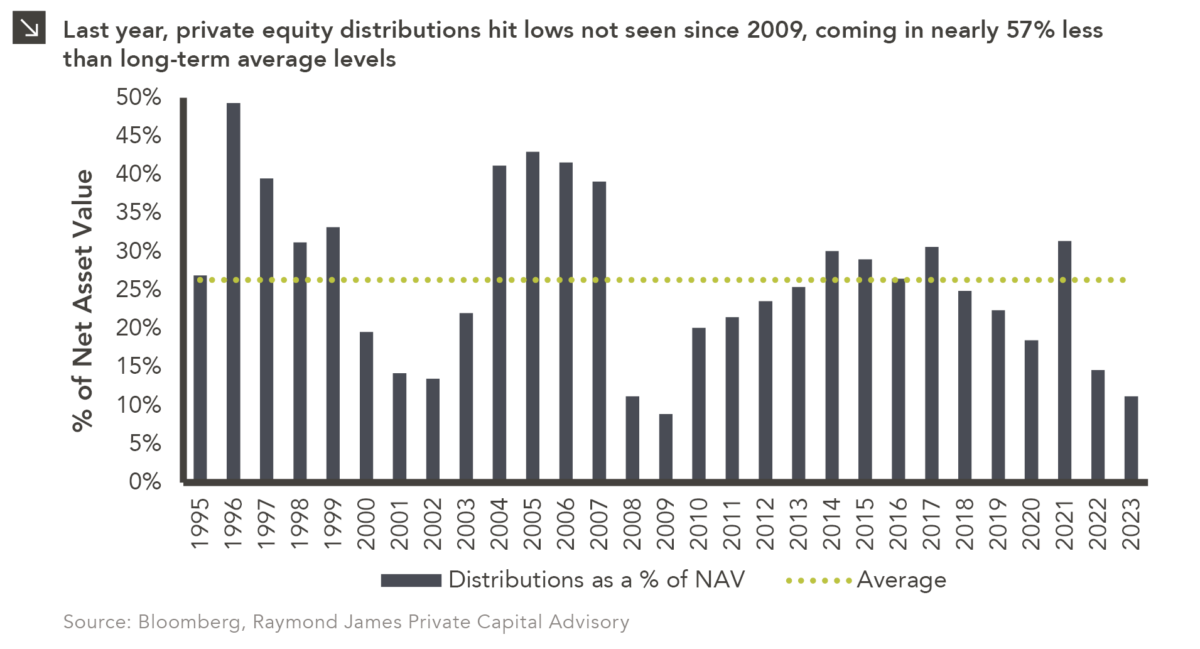
There are multiple ways to gauge how private markets managers are performing, such as benchmarking returns relative to their peers within their respective vintage years. Net internal rate of return (“IRR”), total value to paid in capital (“TVPI”), and distributed to paid in capital (“DPI”) are measurements that are among the most common. DPI is calculated as a ratio of cash returned to cash paid by the investors and is the one metric of the three that cannot be manipulated via subjective valuations. This metric is also not impacted by time. In effect, DPI does not lie… Or does it?
In 2023, distributions from private equity funds as a percentage of portfolio NAV stood at 11.2%, which represents the lowest figure since 2009. Given the slow exit environment over the past 18 months and the quick deployment pace of 2021 and 2022, many general partners are using creative methods to return capital to investors in advance of their next fundraise (absent a true exit). These methods include net asset value (or NAV) loans and continuation vehicles. Alternative methods of liquidity like these will engineer a boost in DPI in the short term but may increase risk and dampen overall returns as net capital outstanding contracts.
While deal activity remains depressed relative to 2021 and 2022, 2023 marked a return to normalcy relative to long-term average levels. This could mean that the pace of exits isn’t far behind, and DPI will remain private equity’s most veracious performance metric.
Long and Variable Lags

The Federal Reserve has waged an aggressive campaign against elevated inflation in recent time, having raised its policy rate from near 0% to over 5% in just over one year. These actions represent the fastest pace of tightening in the history of the central bank. Since the Fed began hiking in the first half of 2022, readings of core CPI, which strips out more volatile components of the headline CPI calculation like food and energy prices, have retreated from a peak of over 6.5% to roughly 3.9% as of the time of this writing. While this moderation of core inflation has led to increased (and perhaps overly) positive sentiment on the part of many investors, it is important to remember that the battle against high price levels has not yet been won. The week’s chart attempts to underscore that point by highlighting the amount of time it has taken for peak inflation to reach more trough-like levels (i.e., those closer to the long-term median core CPI reading) over the last several decades. Readers may be somewhat disheartened to learn that it has taken an average of around two years for inflation to go from peak to trough, with the last two instances requiring roughly three years. For context, the peak figure from the current cycle came 17 months ago.
As it relates to the reason for these long-lasting campaigns against inflation, Fed Chair Jerome Powell has noted the “long and variable lags” with which monetary policy often acts. According to the Fed, one explanation of these lagged effects is that many economic transactions involve prices and quantities that are agreed upon months in advance by the buyer and seller. If these agreements occur in advance of significant changes in monetary policy, they will naturally not be influenced by new levels of interest rates. Additionally, the Fed has noted that lags may arise from the “inattentiveness” of business owners, who may set prices on an infrequent basis to avoid “menu costs,” or the costs associated with price updates. Such behavior would lead the current economic reality to be unreflective of the current monetary policy. Whatever the reasons for the lags detailed above, precedent clearly shows that it may take additional months for inflation to retreat closer to long-term average levels, which may lead to an environment of higher-for-longer interest rates.
Looking ahead, the CPI figure for February is scheduled to be released on March 12. This reading will likely prove informative as investors attempt to determine future actions of the Federal Reserve, which is currently expected to cut rates three to four times this year. Interestingly, market participants expected as many as six rate cuts in 2024 just a few months ago. Marquette will continue to monitor the macroeconomic landscape and provide updates to clients accordingly.
Show Some Maturity

As interest rates remain elevated, some market participants have questioned the extent to which the maturity wall in the below investment grade fixed income market is a sign of increased risk. On paper, concerns related to the maturity wall are understandable, as high yield and leveraged loan issuers face higher financing costs due to increased credit risk. Further, these companies could struggle to refinance debt as it matures and, as a result, incur much higher interest expenses in the future. These dynamics may lead to an eventual increase in default rates and create headwinds for fixed income performance.
In recent time, however, there have not been significant issues when it comes to below investment grade issuers refinancing debt and extending maturities. Since the beginning of 2023, the amount of high yield and leveraged loan debt maturing in 2024, 2025, and 2026 has been reduced by a combined $472 billion, which constitutes roughly 17% of the current market for outstanding high yield bonds and leveraged loans. Additionally, the pace of refinancings and the reduction in impending maturities has only accelerated over the more recent term, as issuers took advantage of lower interest rates in the fourth quarter of last year to term out debt. To that point, more than $54 billion of high yield and leveraged loans have been refinanced over the past three months alone. This is roughly double the pace of 2022, during which $28 billion was refinanced every three months, and nearly five times the $11 billion being refinanced every three months in 2021, during which the market for new issuance was almost non-existent.
Although refinancings abound in 2024, concerns related to impending maturities are not entirely unfounded. Over the next three years, over 21% of the below investment grade market is scheduled to mature. While this number is down slightly from year-end, it remains close to recent-term highs. However, this increased pace of refinancings is a welcome sign for fixed income markets broadly. Fundamentals remain resilient in the below investment grade space, and this resilience will likely allow companies to bear higher interest costs and continue to extend out maturities to time periods that may exhibit more rate favorability.
If the Treasury Curve Could Talk
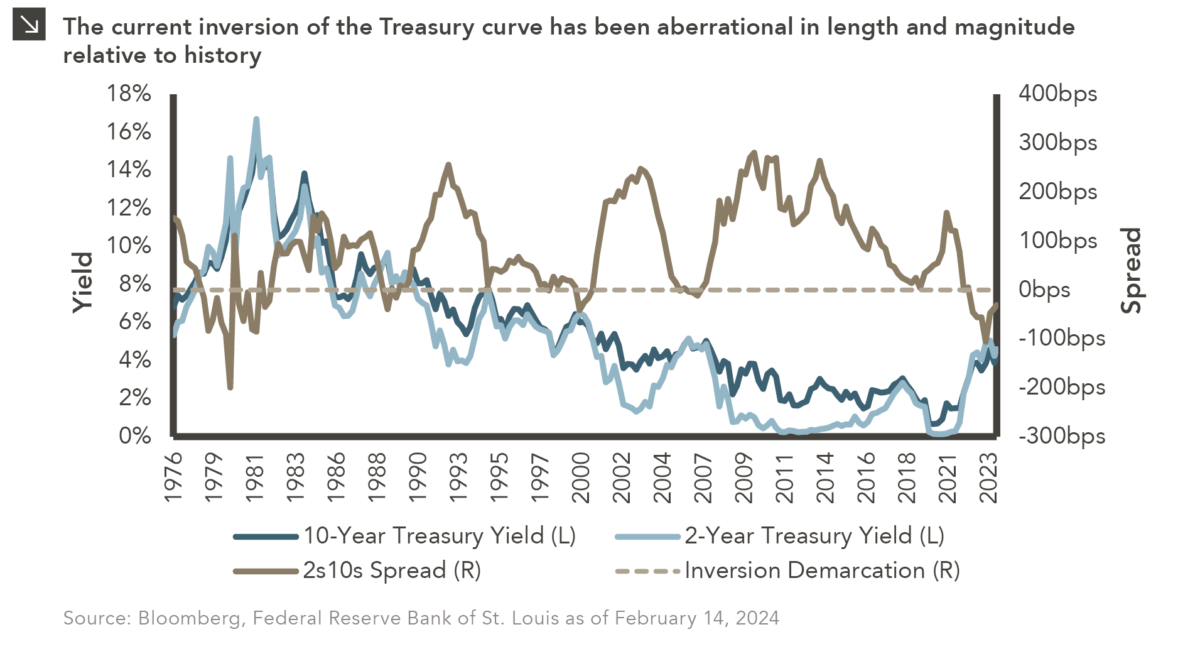
While most of Marquette’s research is written in the third person, this edition of our Chart of the Week series endeavors to anthropomorphize a key feature of the financial system to provide a unique perspective on the current state of capital markets. The following is what readers might expect to hear from a sentient Treasury curve, which is currently suffering from a prolonged inversion.
I just want to feel “normal” again.
For most of my life, longer-dated bonds have provided higher yields than those with shorter maturities. This is often the case since investors expect increased compensation for the increased risks (e.g., higher duration, lower liquidity, etc.) associated with holding long-term bonds, and I am considered upward sloping and normal when these factors are at play. On certain occasions, however, I have been upended as a result of the reversal of those dynamics, though I have usually been able to snap out of those periods of inversion relatively quickly. To that point, the average length of my inversions was less than one year prior to my current funk, which began in July of 2022 and has yet to abate. During this painful time, the 2-Year Treasury yield has been higher than that of the 10-Year by an average of 54 basis points. Put simply, I feel stuck.
The last time my inversion was this prolonged or this extreme was during a period of roughly 20 months beginning in the late 1970s amid rampant stagflation. Led by Paul Volcker, the Federal Reserve began aggressively raising the federal funds rate in 1978 to combat elevated price levels, and these efforts led to an acute inversion of more than 200 basis points. I was offered a brief respite in May of 1980, but this period of normalization lasted only a few months before short-term rates started moving higher once again. You may remember this period as the “double-dip recession,” but I think the “double-dip inversion” is just as apt a descriptor given my behavior! I have inverted on a few occasions since that difficult time. Specifically, I became inverted again in the late 1980s after a lengthy peacetime expansion drove inflation higher and the federal funds rate increased as a result. Still, that inversion lasted less than a year, as then-Fed Chair Alan Greenspan was forced to cut rates to mitigate a recession that began in 1990. I next became inverted when the Fed increased rates in the early 2000s after the longest period of domestic economic growth to that point. This inversion lasted around seven months before Greenspan came to the rescue once again by cutting rates following the busting of the Dot-Com Bubble, a fall in business investing, and the September 11th attacks. When I became inverted in the lead-up to the Global Financial Crisis, it was Ben Bernanke who straightened me out after just six months.
As I mentioned earlier, my current inversion is particularly pronounced relative to my history, and I have spent the last several months asking myself the following question: How can I get out of this predicament? In theory, longer-dated yields could increase and restore my normalcy, however market participants have such strong demand for long-dated bonds at present that those yields may be range-bound. With that in mind, an appeal to Jerome Powell to lower the federal funds rate may be my only hope. This being the case, you can imagine my dismay at this week’s CPI reading, which came in hotter than expected at 3.1% on a year-over-year basis. Until we see inflation inch closer to the 2.0% target established by the Fed, I believe that Powell will likely hold short-term rates at their current levels and my inversion will continue.