Healthcare systems have faced an onslaught of challenges in recent years. They had to navigate the operational and financial headwinds stemming from COVID-19, a severe labor shortage, and 2022’s double-digit drawdowns in both stocks and bonds. Since the end of 2022, global equity markets have returned more than 70% cumulatively, but a combination of portfolio draws and elevated cash expense growth has left median days cash on hand roughly flat. Going forward, balance sheet liquidity is likely to be restrained. While operating margins are improving, the appetite for capital spending remains high and the effects of the One Big Beautiful Bill Act have yet to emerge. At the same time, equities are expensive and credit spreads are tight, limiting the margin for error. Health systems need to carefully weigh the risks of a significant market decline with the need for long-term growth.
Author: cvernon
The Passive Performance Podium
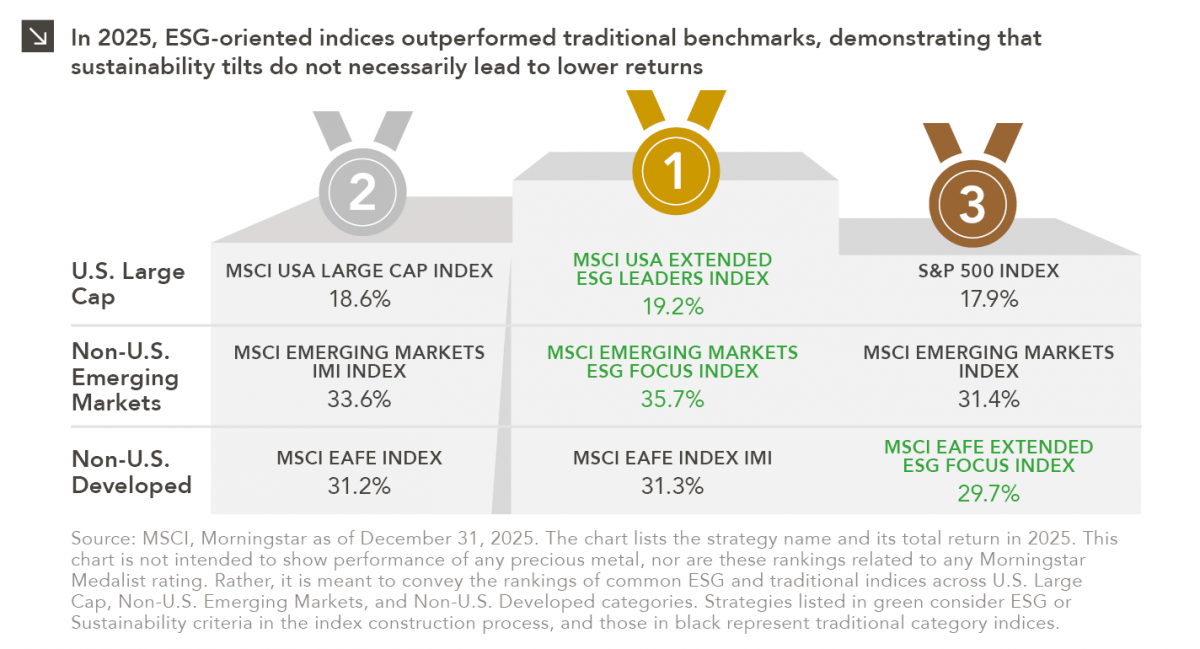
Performance is a key attribute of any investment strategy with a values-based or sustainability focus. As such, analyzing the 2025 returns of traditional indices and those of their ESG-integrated equivalents seemed like a worthwhile endeavor, especially given the 25th Winter Olympic Games currently taking place in Italy. The purpose of this assessment was to evaluate how ESG-oriented indices performed against traditional indices in the U.S. Large Cap, Emerging Markets, and Developed International equity spaces to determine the “passive performance medalists” of 2025.
Before evaluating returns, it is important to outline how ESG-oriented indices are constructed, given that a degree of tracking error is always to be expected from these benchmarks. According to MSCI, each ESG index seeks a risk and return profile that is similar to the broad market index it is designed to track, while also targeting improved sustainability characteristics and avoiding controversies. Of course, nuances exist across different flavors of sustainability indices. For instance, the “ESG Leaders” approach differs slightly from that of “ESG Focused” indices in that it overweights higher scoring ESG names against sector peers and utilizes additional screens. Key examples include the following:
- MSCI USA Extended ESG Leaders Index: Applies exclusions related to alcohol, Arctic oil and gas production, controversial weapons, nuclear power, palm oil, thermal coal, tobacco, fossil fuel extraction, and gambling.
- MSCI Emerging Markets ESG Focus Index and MSCI EAFE Extended ESG Focus Index: Both apply exclusions related to civilian firearms, controversial weapons, tobacco, thermal coal, and oil sands.
The time has now come to award the medals. In the U.S. Large Cap space, the ESG Leaders approach landed atop the podium in 2025, as overweight positions in best-in-class Communication Services companies proved fruitful last year. Within Emerging Markets, the MSCI EM ESG Focus Index took home gold with the highest absolute outperformance thanks to positive stock selection effects in sectors including Information Technology, Health Care, and Energy (where being underweight also contributed to excess returns). Finally, a photo finish determined the gold/silver outcome for traditional indices in the EAFE space. The MSCI EAFE ESG Index trailed the two traditional benchmarks due to its weapons-related exclusions and lower exposure to companies in construction and mining spaces, which hampered relative returns given Europe’s increased focus on defense and infrastructure.
The fact that passive ESG indices fared well outside of the EAFE space in 2025 serves as a reminder that funds that track these benchmarks may make sense for the following types of market participants:
- Mission-aligned investors who do not see their values fully reflected in certain segments of their portfolios
- Purpose-driven or traditional investors who may consider passive vehicles as placeholders before identifying a viable active manager
It is important to note that understanding the nuances of different ESG-focused products is crucial, as many involve exclusions, additional risk management levers, and screens that will create absolute and relative performance variability. Still, if a lesson can be learned from 2025, it is that investors can enjoy strong performance from passive equity strategies while also tilting toward securities with more sustainable characteristics.
Precious Metals Lose Their Luster… Perhaps

Precious metals have been going on a magnificent run in recent years. Specifically, gold moved from $1,898/ounce at the end of 2020 to $5,375/ounce on January 29 of this year, which represents a gain of 181%. During that same time, silver exhibited a more volatile but highly correlated return pattern, moving from $26/ounce to $116/ounce for a gain of 338%. Then came Friday, January 30. On that day, gold dropped more than 12%, its biggest intraday decline since the early 1980s. Silver plunged by a staggering 36%, a record intraday decline for the metal. The fall continued in February, with gold and silver falling to $4,661/ounce and $79/ounce, respectively. Markets have bounced back somewhat in recent days, with gold climbing by roughly 6% and 3% on Tuesday and Wednesday of last week, respectively. Silver advanced on those days as well. Despite this recent pop, many investors are asking the following question given the sharp decline in gold and silver: Have precious metals lost their luster?
To answer this question, it is worthwhile to first outline the reasons for the run-up in gold and silver over the last several years. A primary factor driving strong precious metal performance is global inflation and geopolitical instability (e.g., tensions between the U.S., Russia, China, and the Middle East) that has pushed investors to seek safety in more traditional stores of value. Tariffs and trade-related conflicts have exacerbated this flight to perceived safety. Additionally, developed economies continue to run significant budget shortfalls, leading investors to gold over bonds as governments continue to issue debt to fund deficits. Individual investors are not the only ones that are adding to their gold reserves, as central banks around the world have been purchasing record amounts of gold in recent years as part of a push toward tangible asset ownership. Finally, there have been tailwinds specific to silver, including a structural deficit, thinner trading markets, and its usage in AI infrastructure, data centers, electric vehicles, and solar panels.
After the rally came the fall on January 30, when the Trump administration tapped Kevin Warsh to lead the Federal Reserve. Traders viewed Warsh as the toughest inflation fighter among the finalists for the position, and his nomination increased expectations of U.S. dollar strengthening and weaker precious metals in dollar terms. The slide in precious metals may have been exacerbated by a gamma squeeze, in which dealers must sell positions as prices fall to maintain balanced portfolios.
Fast markets make commentary quickly obsolete, and it is possible that metals markets will exhibit additional volatility in the weeks ahead. This volatility, as well as potential storage costs and the speculative nature of the space, are drawbacks of precious metals investing, and investors should treat commodities like gold and silver with caution given these risks. Time will tell if gold and silver have indeed lost their luster.
K-Shaped Conundrum
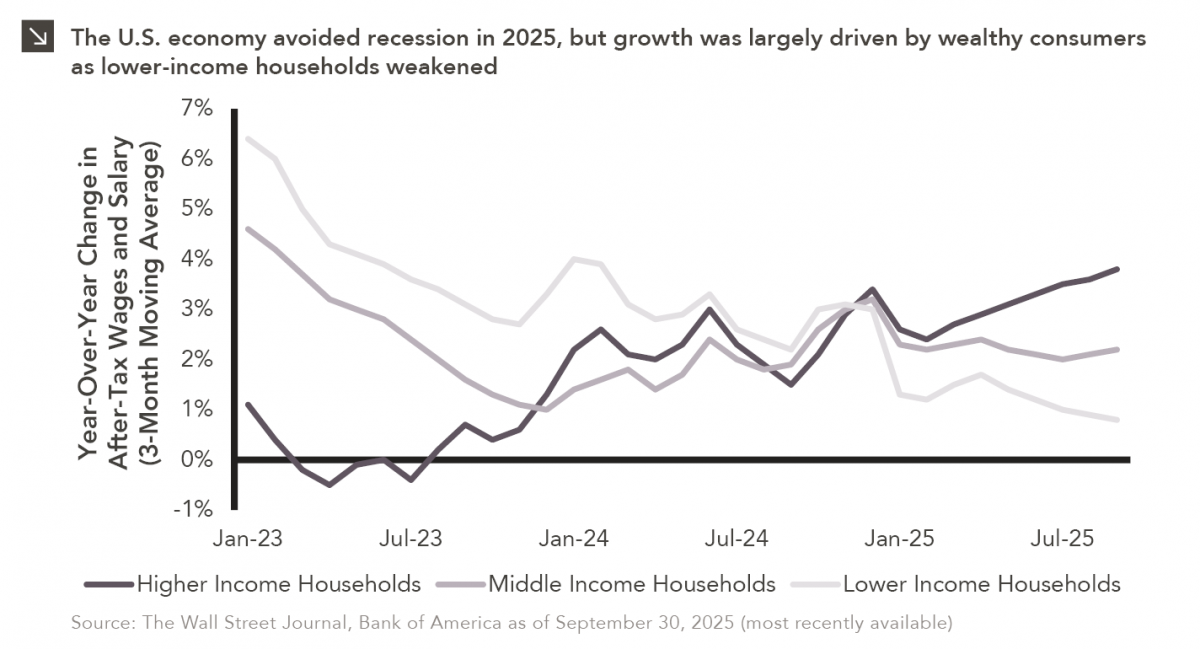
Macroeconomic forecasting is challenging in the best of times and proved downright impossible in 2025, which saw high levels of geopolitical instability and policy uncertainty. Many economists were cautiously optimistic about the state of the global economy at the start of last year, only to revise growth forecasts sharply downward after President Trump’s tariff announcements in April. By summer, markets and economists alike were still largely convinced that a recession was imminent, but this anticipated downturn did not materialize. On the contrary, high-level GDP and consumer spending data for 2025 suggest stable (albeit slowing) economic growth. Despite steady headline figures, however, concerns remain surrounding potential softening of the domestic labor market and slowing real-wage growth. As illustrated by the chart above, these effects are distributed unevenly across income brackets, with wages rising by 3.8% for the highest-earning households over the last year, compared to only 0.8% for lower-earning households. Consumption for lower-income households has also declined in recent time, with a Moody’s survey estimating that the top 10% wealthiest U.S. households now account for roughly half of all consumer spending. Equity market performance has exacerbated this inequality, as wealthier individuals tend to have a larger percentage of their net worth invested in financial assets.
Economic bifurcation, often referred to as a “K-shaped economy,” explains why strong GDP growth can occur in tandem with deteriorating consumer confidence. This dynamic has also challenged policymakers, as institutions like the Federal Reserve have been tasked in recent years with both cooling inflation and preventing further labor market deterioration. Moreover, as lower-income households struggle to finance essential purchases, it is possible that future GDP growth will be contingent on wealthier households spending at current or higher rates. It follows that an event that leads to a pullback in spending (e.g., an equity market downturn) could be detrimental to overall growth. While predicting the trajectory of the economy is certainly a challenge, understanding these dynamics offers some insight into the indicators to monitor in 2026.
Pining for Evergreens
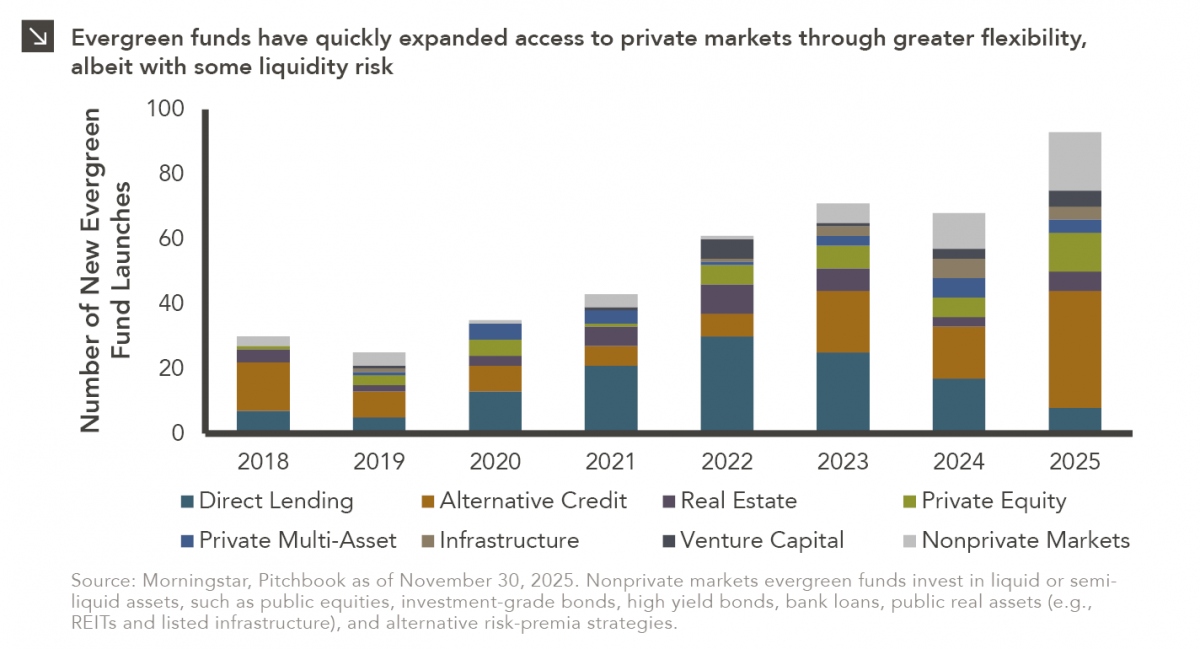
In recent years, access to traditionally illiquid private markets has expanded through the rapid growth of evergreen funds, which provide investors with more favorable subscription and liquidity terms than traditional closed-end vehicles. New evergreen fund launches notably increased from 30 in 2018 to 107 in 2025, with alternative credit strategies emerging as the primary driver of this growth (36 new fund launches last year). Many new funds have also come to market in the private equity, real estate, and infrastructure spaces, and these dynamics can be observed in the chart above. There are more than 500 active evergreen funds available to investors currently.
Broad adoption of the evergreen structure reflects growing demand for more illiquid assets across both institutional and retail investors. In addition to the advantageous terms mentioned above, many offer seasoned and diversified exposures, which can help mitigate the J-curve effect that is exhibited within private markets. Many evergreen funds also have lower investment minimums and less operational complexity relative to closed-end vehicles. All of these factors have contributed to the proliferation of evergreens detailed above. It is important to note, however, that there are drawbacks associated with evergreen fund investing, including potential liquidity mismatches and gating risk. Overall, while evergreen funds have broadened access to private markets through greater flexibility and lower barriers to entry, investors must balance these benefits against the structural liquidity and redemption risks inherent in illiquid asset classes.
Seventy-Five Horses and Two Pieces of Plastic
Anyone who has gone snowmobiling knows it can be simultaneously exhilarating and terrifying. Throttling across snow and through a forest powered by a 75-horsepower engine with two plastic skis to steer makes it hard to feel like one has complete control; 30 mph in the open air feels more like 100!
Nonetheless, operating a snowmobile is pretty straightforward: The throttle is a right-thumb button, the brake is a left-hand squeeze lever. Beyond those two controls, it’s up to the driver to effectively navigate the trail, with the critical concession that the terrain is out of anyone’s complete control. Which brings me to our 2026 market outlook.
The “throttles” for portfolios are the usual constituents: equities, below investment grade credit, and private markets. The “brakes” are investment grade fixed income, particularly Treasuries which can slow a portfolio’s losses if the market tumbles. The terrain is naturally the actual path that each of these asset classes will follow in 2026. Since 2022 the equity market ride has been mostly exhilarating, save for some of the terrifying moments like the market dip after Liberation Day. But that’s in the rearview mirror, and the focus is what is around the bend. Will the thrill continue, or should we ease up on the throttle?
Concentrating on Market Concentration
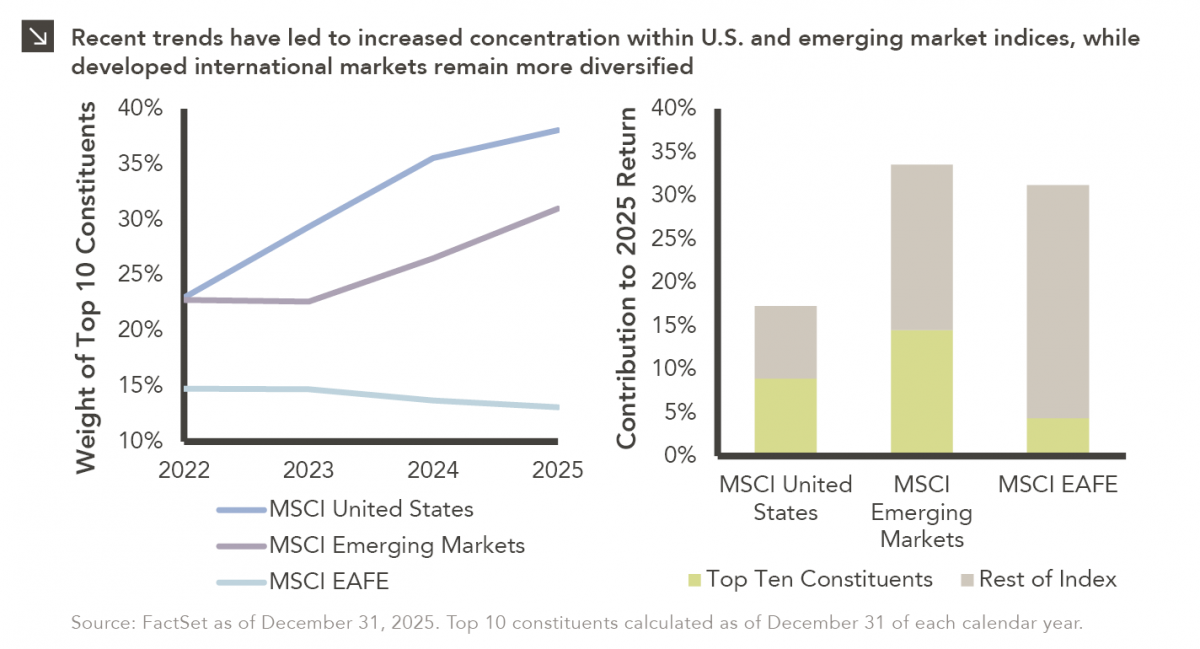
Last week, Alphabet joined NVIDIA, Microsoft and Apple as the only companies to ever reach a market capitalization of $4 trillion. The growth of these and other U.S. mega-cap technology companies has completely changed the composition of indices that measure the domestic equity market. Indeed, the weight of the top 10 constituents of the MSCI United States Index (which is comprised of large- and mid-cap stocks) sat at roughly 23% just three years ago. At the end of last year, however, that figure sat closer to 38%. As can be seen above, this concentration has resulted in a handful of stocks driving a significant share of overall index returns in recent periods. Interestingly, the theme of market concentration is not exclusive to domestic indices. For instance, companies in China, Taiwan, and South Korea have helped provide the materials required for the artificial intelligence boom, and the growth of these businesses has led to higher levels of concentration for the MSCI Emerging Markets index. The top 10 constituents now represent slightly less than one-third of this index, and TSMC, the largest producer of semiconductors in the world, notably comprises roughly 12% of the benchmark. Similar to trends within domestic markets, these top constituents had an outsized impact on the return of the MSCI Emerging Markets Index in 2025.
Interestingly, the MSCI EAFE Index, which is comprised of non-U.S. developed markets large- and mid-cap stocks, has not followed these same trends, with the weight of its top 10 constituents actually decreasing in recent years. While its largest holding is ASML, a supplier for the semiconductor industry, this benchmark is not nearly as heavily tilted towards the AI boom as domestic and emerging markets indices. For this reason, developed international markets could be a stronger source of diversification for investors moving forward.
2026 Market Preview

This video is a recording of a live webinar held January 15 by Marquette’s research team analyzing 2025 across the economy and various asset classes as well as themes we’ll be monitoring in 2026.
Our quarterly Market Insights series examines the primary asset classes we cover for clients including the U.S. economy, fixed income, U.S. and non-U.S. equities, hedge funds, real assets, and private markets, with commentary by our research analysts and directors.
Featuring:
Greg Leonberger, FSA, EA, MAAA, FCA, Partner, Director of Research
Frank Valle, CFA, CAIA, Associate Director of Fixed Income
James Torgerson, Senior Research Analyst
Catherine Hillier, Senior Research Analyst
David Hernandez, CFA, Director of Traditional Manager Search
Evan Frazier, CFA, CAIA, Senior Research Analyst
Dennis Yu, Research Analyst
Amy Miller, Associate Director of Private Equity
Chad Sheaffer, CFA, CAIA, Associate Director of Private Credit
Sign up for research alerts to be invited to future webinars and notified when we publish new videos.
If you have any questions, please send our team an email.
Where Should Investors Land on the Aggregate Continuum?
Contrary to widespread belief, fixed income aggregate strategies offer a continuum of active risk and return profiles. While aggregate strategies broadly aim to provide income, diversification, and liquidity, varying degrees of excess return exist. Investors must choose what suits their active risk and return goals.
Fixed income mandates are described by their beta and benchmarked to a similarly named index. For example, long credit is benchmarked to the Bloomberg Long Credit Index and high yield is benchmarked versus the Bank of America High Yield Master II Index. Once a beta is selected, then an alpha objective is chosen for the mandate. Some mandates in the universe have an alpha target of benchmark plus 50 basis points (bps), while others target an excess return of 100bps or more.
However, this is not true for aggregate strategies. The beta and index are the Bloomberg Aggregate Index. Rather than having different objectives, aggregate mandates have different “asset classes.” The aggregate continuum should not be thought of as different asset classes, but rather different active risk and return profiles.
This white paper outlines considerations for investors when choosing a fixed income aggregate strategy, including an overview of the Bloomberg Aggregate Index, how investment managers can generate active risk, excess return targets, and the important distinction between risk and active risk.
I Drink Your Milkshake
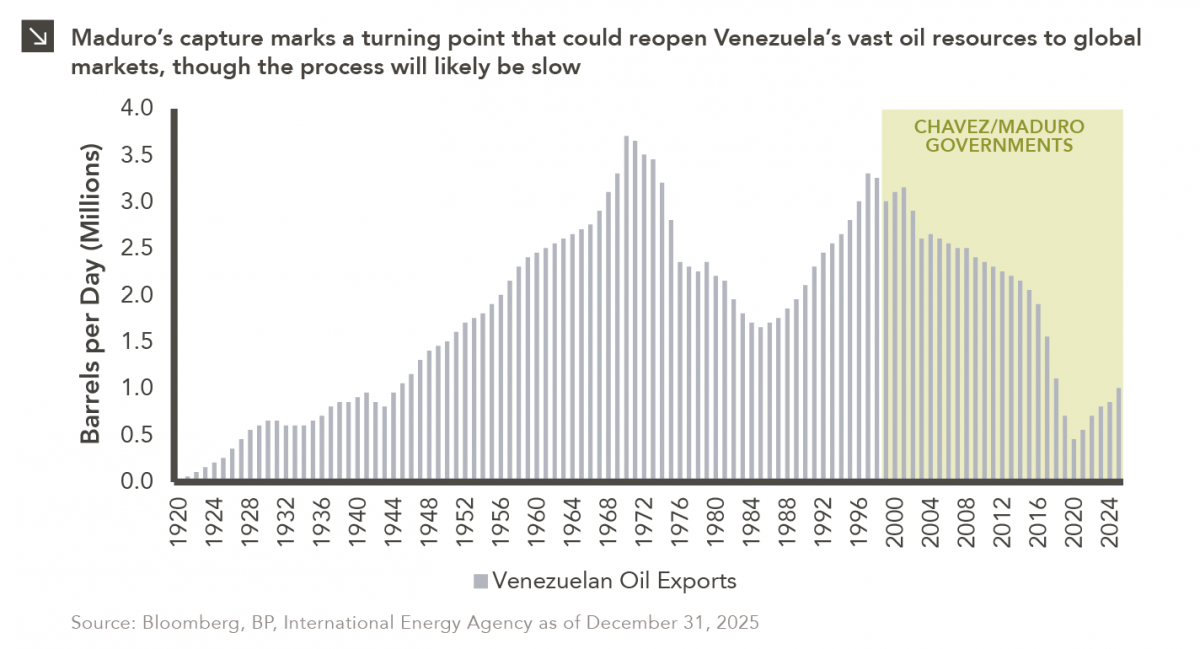
The capture of Venezuelan president Nicolás Maduro is a watershed moment for a country whose natural resource economy has been managed by an interventionist, state-centric regime for nearly 30 years. Indeed, Maduro’s detention effectively ends the command-and-control model that had long governed Venezuela’s oil sector, in which the state-owned oil company PDVSA functioned largely as a political instrument rather than a commercial enterprise. Once a technically competent producer, PDVSA was hollowed out in the early 2000s as revenues were diverted to fund government spending, skilled workers were purged, and maintenance and reinvestment were neglected. As can be seen in this week’s chart, this led to a steep decline in Venezuelan production and export capacity. For global markets, the immediate significance of the ousting of Maduro lies less in the regime change itself than in the potential reopening of one of the world’s largest hydrocarbon endowments after years of sanctions and operational decay.
In the short run, Venezuelan oil exports are likely to increase modestly but unevenly. Although the nation’s output has already started to recover from its 2020 trough due to limited sanctions waivers and ad hoc deals, infrastructure constraints remain severe. Years of deferred maintenance have left pipelines, ports, and storage facilities in poor condition, while a shortage of skilled labor and reliable power continues to limit throughput. As a result, any additional barrels reaching export markets will likely come primarily via better utilization of existing fields rather than large-scale new investment, at least over the coming months. Deals that redirect crude toward the United States (particularly heavy oil suited for Gulf Coast refineries) could shift trade flows quickly, but they do not solve the deeper structural problems of the industry. Near-term export gains are therefore likely to be measured in hundreds of thousands of barrels per day rather than a return to Venezuela’s historical multi-million-barrel output.
Over a longer time horizon, the toppling of Maduro could reshape Venezuela’s oil sector more profoundly by altering its relationship with foreign capital and global commodities markets. International oil companies have long viewed Venezuela’s reserves as attractive but effectively uninvestable due to sanctions risk, opaque governance, a history of expropriation, and weak contract enforcement. A political realignment raises the possibility of a gradual normalization of commercial terms, including joint ventures, profit-sharing mechanisms, and clearer legal protections for market participants. However, analysts widely agree that rebuilding production capacity would be a long and risky process, likely requiring tens of billions of dollars and many years of stable policy. Further complicating matters is Venezuela’s exceptionally high methane intensity, which makes its crude oil among the most emissions-intensive in the world and increasingly problematic for buyers facing stricter environmental standards. Addressing these environmental liabilities would add both cost and time to any meaningful expansion of exports.
Beyond oil, Venezuela’s broader natural resource abundance adds an additional layer of significance to the recent change in leadership. Specifically, the country sits atop substantial reserves of gold and other strategic minerals, and renewed export capacity could feed into a broader bull market in commodities if supply constraints ease. It is important to remember, however, that recent events do not automatically translate into a clean political transition, and the near-term outlook for Venezuelan commodities exports remains shaped by institutional fragility, security risks and unresolved questions about who exercises authority over production, contracts, and revenues. Ultimately, Maduro’s capture creates an opening rather than a resolution, as it increases the probability that Venezuelan resources re-enter global markets at scale, but it does not eliminate the risks that have defined the country’s commodities sector for years.