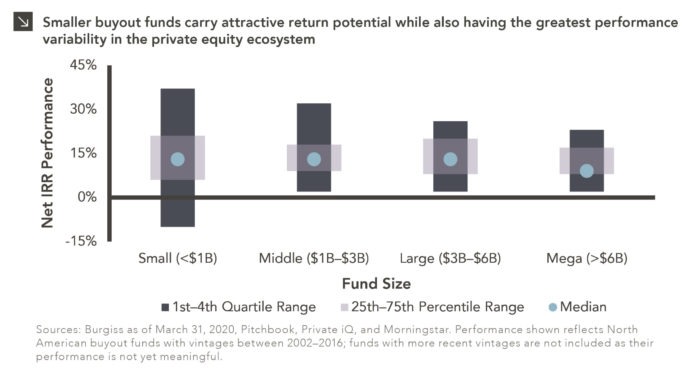
Is Velocity Stifling Inflation Amid Record Growth of Money Supply?

Inflation has remained well below 3% in the United States for nearly a decade despite a record economic expansion and supportive monetary policy. Even after unprecedented alterations to the macroeconomic landscape in recent months, investors have not seen the significant price level increases that might have been expected in theory. This puzzling situation may be at least partially explained by the current relationship between money supply and velocity.

When it comes to economic relief efforts in the U.S. during 2020, no entity has been more active than the Federal Reserve, which has increasingly relied on open market operations with short-term interest rates near zero. Since the start of the pandemic, the Fed has purchased $3.5 trillion in Treasuries, corporate bonds, and mortgage-backed securities, and recently announced its intention to press forward with $120 billion per month in additional bond buying. The central bank’s balance sheet has now ballooned to over $7 trillion. As a result, M2 ­— a measure of the total money supply that includes narrow money, cash equivalents, and short-term deposits — spiked by roughly 25% in 2020, a record year-over-year growth figure.¹ The recent M2 surge has been accompanied by a decrease in the velocity of money, calculated as the ratio of quarterly nominal GDP to the quarterly average of M2 money stock. Put simply, velocity denotes the rate of turnover in the money supply and is a gauge of economic health, as higher velocity is usually associated with more robust economic activity. Since the beginning of 2020, money velocity has fallen by more than 20%, indicating a strong preference for saving vs. spending on the part of the American consumer since the outbreak of COVID-19.

The relationship between money supply and velocity has significant implications for security markets going forward, particularly as it relates to inflation. Investors have long been confounded by the absence of inflation in the U.S. since low interest rates and M2 growth should lead to higher price levels all else equal. Part of the reason for the lack of inflation could be lower levels of money velocity, which has largely declined since 2000 amid three significant recessions in the United States. The recent plunge in velocity may signal to central bankers that expansionary efforts could be continued in the near term without the risk of significant price level increases. As the economic recovery continues, however, velocity will necessarily rise, which could lead to interest rate hikes and the tapering of the Fed balance sheet to prevent runaway inflation. Investors should be cognizant of the possibility of restrictive monetary policy in the coming years as the world lifts itself out of recession.

Print PDF > Is Velocity Stifling Inflation Amid Record Growth of Money Supply

¹As measured on November 30, 2020


The opinions expressed herein are those of Marquette Associates, Inc. (“Marquette”), and are subject to change without notice. This material is not financial advice or an offer to purchase or sell any product. Marquette reserves the right to modify its current investment strategies and techniques based on changing market dynamics or client needs.

Additional Relief Stimulus to Bridge Gap as Vaccine Distribution is Underway

While the recent approval and rollout of the Pfizer and Moderna vaccines would be expected to assist in the gradual economic recovery from the COVID pandemic, the Federal Reserve emphasized last week that approximately six months of both monetary and fiscal stimulus are needed to bridge the gap between now and adequate vaccine distribution to support herd immunity by 2H21. As such, Congress over the weekend finally reached an agreement on an approximate $900 billion fiscal stimulus package, and after passing through both houses Monday, President Trump is expected to sign it into law today.

The package includes aid for many Americans including $300 per week in federal unemployment benefit enhancements and $600 individual stimulus checks, as well as support for small businesses, healthcare, transit, schools, and vaccine rollout. In this paper, we will begin with an assessment of the stimulus packages to date, followed by highlights on key aid to individuals, businesses, and governments in this latest package. Next, we will discuss an interpretation and analysis of this relief deal in the context of key financial market and economic indicators. Finally, we will conclude with a look to next steps.

Read > Additional Relief Stimulus to Bridge Gap as Vaccine Distribution is Underway


The opinions expressed herein are those of Marquette Associates, Inc. (“Marquette”), and are subject to change without notice. This material is not financial advice or an offer to purchase or sell any product. Marquette reserves the right to modify its current investment strategies and techniques based on changing market dynamics or client needs.

Can TIPS Be an Effective Inflation Hedge for Portfolios?

With the COVID vaccine’s worldwide distribution and adoption starting last week, many investors are aiming to project an inflation outlook driven by the return of furloughed workers and impending economic recovery and adjust portfolios with inflation protection in mind.

In this newsletter, we examine how key asset classes in institutional portfolios behave in rising or declining inflation environments, and ultimately determine the best asset classes that serve as inflation hedges while also providing strong total return and efficiency ratios. In particular, we investigate if TIPS (Treasury Inflation-Protected Securities) offer superior inflation protection compared to other common portfolio constituents.

Read > Can TIPS Be an Effective Inflation Hedge for Portfolios?


The opinions expressed herein are those of Marquette Associates, Inc. (“Marquette”), and are subject to change without notice. This material is not financial advice or an offer to purchase or sell any product. Marquette reserves the right to modify its current investment strategies and techniques based on changing market dynamics or client needs.

Market Recovery: Superpower Showdown

Despite the enormous challenges of 2020, financial markets have rebounded. While baffling at face value, the contrast between market performance and the widespread suffering due to COVID-19 is more understandable in the context of markets as a representation of human ingenuity and resiliency. These two traits are perhaps most recognized in the world’s foremost economic superpowers: The United States and the People’s Republic of China. During the third week of March, both countries saw market drawdowns near 30%; most other equity indices across the world saw similar drops. Since the global market bottom, countries have been racing to make up these losses and charge ahead to new highs. As of December 11th, America’s recovery has been nearly a third stronger than China’s. Globally, the recovery has fallen in between these two world powers.

A dollar invested in American public equities on March 23rd would have grown to $1.72 as of last Friday, December 11th, as represented by the Russell 3000 (representing approximately 98% of the investable U.S. equity market¹). Over this same time span, a dollar invested in China would have driven an increase to $1.54, as represented by the MSCI China Index. This broad market index captures 85% of China’s equity universe and includes the variety of share classes available to both strictly domestic Chinese investors as well as foreign investors.² However, America’s strength in capital markets recovery does not reflect the country’s relative success in managing the virus. In the U.S., the fight drags on, while much of China has returned to business as usual.³ Broadly, capital markets as measured by the All Country World Index (ACWI) — which contains 85% of the global equity markets, including 23 developed countries and 26 developing countries² — has rebounded at a clip between that of the U.S. and China. The good news for investors is that equity markets — regardless of home country — have rebounded from the extreme drops seen in March and April.

As detailed in our previous Chart of the Week, “Main Street Won’t Look Like Wall Street for a While,” the real-world experience of many Americans is one of continued economic hardship. While this desperate situation may soon be addressed with additional stimulus, Americans and people around the globe can also find hope in the fact that markets are forward-looking and humans, by nature, are resilient and resourceful. As a testament to this, one needs to look no further than the rollout of the highly anticipated and historic COVID-19 vaccine, which saw its first doses administered in the U.S on Monday.⁴ The extreme market volatility and large sell-off early in the year and subsequent recovery have further underscored why a long-term investment perspective rooted in a fundamental confidence in continual technological and economic progress is the most effective mindset an investor can have.

Print PDF > Market Recovery: Superpower Showdown

¹ FTSE Russell
² MSCI
³ China is back to normal — the US and Europe are not. Here’s how it succeeded
First Covid-19 Vaccine Given to U.S. Public


The opinions expressed herein are those of Marquette Associates, Inc. (“Marquette”), and are subject to change without notice. This material is not financial advice or an offer to purchase or sell any product. Marquette reserves the right to modify its current investment strategies and techniques based on changing market dynamics or client needs.

Main Street Won’t Look Like Wall Street for a While

The month of November is often a positive one for equity markets, with the S&P 500 Index posting positive returns 62% of the time, and November 2020 was surely one for the record books. The Dow Jones Index, designed to serve as a proxy for the health of the broader U.S. economy, posted its best monthly return since 1987. Smaller companies also rallied in November as the Russell 2000 Index, which tracks U.S. small-capitalization stocks, set its first record high since 2018 and posted its strongest monthly return ever. That said, a stark contrast emerges when these milestones are viewed beside other economic indicators, particularly unemployment.

Down 54.4% from the April 2020 peak, U.S. national unemployment came in at 6.7% for November. This is exceptionally positive news considering the recent figure is only 0.6% above its 15-year average. However, this aggregated unemployment measure does not highlight the significant disparity plaguing the broader employment landscape.

According to the Bureau of Labor Statistics, the labor market can be divided into 22 unique occupation groups, many of which have been hit harder by the COVID-19-induced recession than others. For example — and perhaps not surprisingly — the four groups most affected by the pandemic include those on the frontlines of human interaction, such as Personal Care & Service, Food Preparation & Serving, Transport & Material Moving, and Building Grounds & Cleaning. While it is clear from the chart that these occupations tend to have a slightly higher rate of unemployment than the national figure, the average November unemployment rate for these groups was a significant 10.7%, coming in 4% higher than the current national level and 2.9% higher than the long-term average of the same groups. Conversely, occupation groups including Healthcare Practitioners, Legal, Computer & Mathematical, and Architecture & Engineering have escaped COVID-19 largely unscathed. These groups posted an average rate of 2.4% unemployment in November, which is 4.4% below the current national level and, in fact, 0.2% lower than their own long-term average. The gravity of this disparity takes on new meaning when viewed through the lens of workforce concentration and wealth generation. The least affected occupation groups employ 11.6% of the workforce, while the most affected groups have nearly double the employee base, at 23.0%. To make matters worse, this larger workforce earns substantially less than their COVID-sheltered peers. According to 2019 data, the most affected groups earned a median annual income of $27,800, which is just over the poverty line for a family of four and $12,000 less than the median income for all occupation groups. On the other hand, for those occupation groups nearing full employment, the median worker earned an annual income of $79,900 in 2019, more than two times the national median.

Ultimately, no two recessions are the same, but perspective can be gleaned by looking to the past. Since 1950, the average U.S. unemployment rate has been a low 5.8%, despite 10 unique bear market corrections during that time. However, the subsequent decline from a spike in unemployment can be slow and long. Looking back to the Global Financial Crisis, U.S. unemployment peaked at 10% in October 2009 and took just over six years to recover back to pre-crisis levels. However, unlike other recessions we have seen in recent memory, this one seems to have a discernible cure: a COVID-19 vaccine. With national distribution beginning before the end of the year, many analysts are expecting the economy to return to ‘normal’ by mid-2021. An unprecedented level of stimulus has already been injected into the economy and an additional highly anticipated package expected to arrive early next year are added reasons for optimism. Taken together, there is hope that current unemployment figures will revert to typical levels at a pace not seen in history.

Print PDF > Main Street Won’t Look Like Wall Street for a While


The opinions expressed herein are those of Marquette Associates, Inc. (“Marquette”), and are subject to change without notice. This material is not financial advice or an offer to purchase or sell any product. Marquette reserves the right to modify its current investment strategies and techniques based on changing market dynamics or client needs.

Cash Balance Product Alternatives & Recommendations in the Current Ultra-Low Yield Environment

With short-term interest rates seemingly stuck at unprecedented low levels, a key challenge for investors today is how best to obtain compelling yields for cash balances as part of an overall portfolio while maintaining safety and principal protection.

In this newsletter, we examine the current ultra-low yield environment and what options investors may consider in their approach to structuring an optimal cash allocation.

Read > Cash Balance Product Alternatives & Recommendations in the
Current Ultra-Low Yield Environment


The opinions expressed herein are those of Marquette Associates, Inc. (“Marquette”), and are subject to change without notice. This material is not financial advice or an offer to purchase or sell any product. Marquette reserves the right to modify its current investment strategies and techniques based on changing market dynamics or client needs.

Is Growth Conceding?

The market’s continued rally following the U.S. election has been a welcome relief, even more so for value investors. Since major media outlets called the presidential race for now President-elect Biden on November 7th, the Russell 1000 Value Index has outperformed the Russell 1000 Growth Index by 6.6%, and at one point by more than 10%. It has been the strongest value run since the dot-com bubble burst in 2001. The Monday following the result, November 9th, was the best single day for value over growth ever.

Presidential elections and other regime changes can often spark a rotation within the market. In this case, in addition to expectations for additional stimulus post the election, the delayed election results lined up with Pfizer’s announcement — and the peer announcements that followed — that its COVID-19 vaccine candidate was found to be more than 90% effective. Stocks generally, but in particular, more cyclical businesses and industries most impacted by the pandemic, rallied and have continued to gain momentum. Banks are up 20% and Energy stocks more than 30%. Technology and Healthcare have lagged despite the Republican gains in Congress that subsequently reduced the risk of sweeping regulatory changes.

The question now is whether value can maintain this momentum. Interestingly, the move is reminiscent of the period following the 2016 election. From the election on November 8th, 2016 to a peak in mid-December, value had outpaced growth by 5%. Financials, along with Energy and Basic Materials, led at that point as well, though for different reasons, set to benefit from expected regulatory rollbacks, tax cuts, and protectionist trade policies. Technology unsurprisingly lagged following Trump’s attacks on Tech bellwethers throughout his campaign. But the high expectations fizzled as Trump’s agenda hit roadblocks. In 2016, value’s advantage lasted roughly a month, with growth back on top by mid-March 2017. Only time will tell how market dynamics will play out this time. Relative to growth, value is trading at some of the most attractive valuations ever. But several of the same trends that led to growth’s dominance over the last decade, and certainly this year, are also arguably stronger than ever.

Print PDF > Is Growth Conceding?


The opinions expressed herein are those of Marquette Associates, Inc. (“Marquette”), and are subject to change without notice. This material is not financial advice or an offer to purchase or sell any product. Marquette reserves the right to modify its current investment strategies and techniques based on changing market dynamics or client needs.

Why Will Yields Remain Low After COVID and What Can Investors Do About It?

As we head into the 2020 year-end holiday season on the heels of positive vaccine news and an all but formally concluded presidential election, investors are turning their attention to what the state of the world economy and financial markets might look like as we potentially return to normal in 2021 and beyond. One key question being asked is where interest rates and bond yields might be headed.

In this newsletter, we explore why we are in such an ultra-low yield environment as well as what key structural transformations need to take place for rates to meaningfully rise to higher levels. Last, we devise a recommended plan of action for how asset owners can address this persistent ultra-low yield environment — even after a COVID recovery — in order to achieve return or volatility targets.

Read > Why Will Yields Remain Low After COVID and What Can Investors Do
About It?


The opinions expressed herein are those of Marquette Associates, Inc. (“Marquette”), and are subject to change without notice. This material is not financial advice or an offer to purchase or sell any product. Marquette reserves the right to modify its current investment strategies and techniques based on changing market dynamics or client needs.

Defined Contribution Plan Legislative Update – 4Q 2020

While legislators have been focused on negotiating the next round of stimulus and dealing with the implications of the recent election cycle, the U.S. Department of Labor (DOL), as the primary regulator of the Employee Retirement Income Security Act (ERISA), has been fairly active with issuing proposed changes and final rules that may impact many of our defined contribution plan clients in the past several months.

This legislative update covers recent communications regarding private investments in defined contribution plans, proxy voting guidelines, ESG considerations (an update to an earlier Proposed Rule), and 2021 contribution limits.

Read > 4Q 2020 DC Legislative Update


The opinions expressed herein are those of Marquette Associates, Inc. (“Marquette”), and are subject to change without notice. This material is not financial advice or an offer to purchase or sell any product. Marquette reserves the right to modify its current investment strategies and techniques based on changing market dynamics or client needs.


The Dollar Returns to Trend (and Could Go Lower)

The dollar has enjoyed an impressive run during the last few years on the backs of trade restrictions, off-cycle expansionary fiscal policy, and muted inflation. That said, the currency has weakened in recent months, as the U.S. Dollar Index — which measures the strength of the greenback relative to a basket of several international currencies — has dropped nearly 10% since the end of March. The index is now nearing its 30-year average of 91.2.

The dollar could fall even further in the near term given the current landscape. While it is unclear exactly how President-elect Joe Biden will govern along the political spectrum, the new administration will almost certainly take a more dovish approach with respect to international trade. A de-escalation of Trump-era tariff wars would be a boon to emerging market equities, which could create trouble for the dollar. Additionally, the lack of additional fiscal stimulus in the United States after the passage of the CARES Act in March, coupled with unprecedented expansionary efforts by the Federal Reserve, is a harbinger of a weaker greenback. Even a new relief package that is more modest in size may not be enough to prevent a further slide in the dollar given the extraordinary scope of the Fed’s support and a sustained low interest rate environment.

It is important to remember that a declining dollar does not necessarily spell doom for the U.S. economy. Goods produced in the United States become more attractive to consumers when the domestic currency is weak, which can lead to job creation in the manufacturing sector and economic growth. Increased global demand for American goods can also lead to trade deficit reductions. If current trends continue, investors will have to weigh these benefits against the costs of a weakening greenback, which include inflation and subsequent increases in commodity prices, as well as lower relative returns for dollar-denominated assets. Now more than ever, allocators should stress the importance of international and style diversification.

Print PDF > The Dollar Returns to Trend (and Could Go Lower)


The opinions expressed herein are those of Marquette Associates, Inc. (“Marquette”), and are subject to change without notice. This material is not financial advice or an offer to purchase or sell any product. Marquette reserves the right to modify its current investment strategies and techniques based on changing market dynamics or client needs.