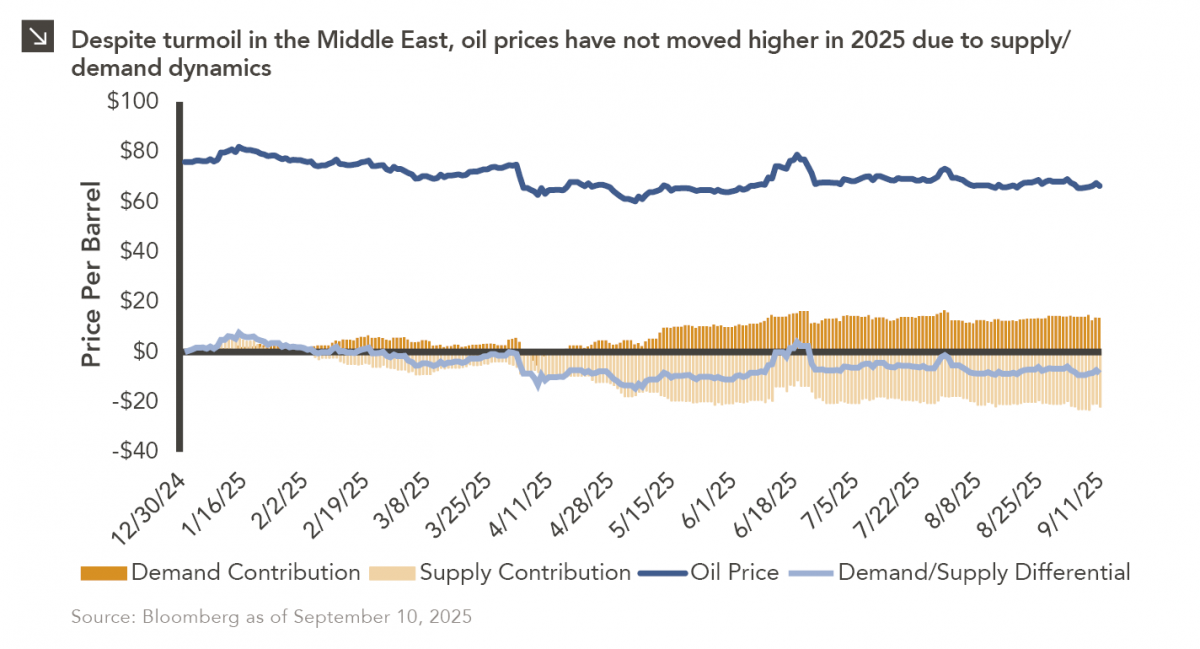
3 vs. 2000

In last year’s “2 vs. 2000” Chart of the Week publication, we explored the emergence of trillion-dollar companies, noting that Microsoft and Apple had each exceeded the combined market capitalization of Russell 2000 Index constituents. Since then, another technology giant has crossed that threshold, with NVIDIA recently becoming the first company to reach a market capitalization of $4 trillion. While Microsoft currently hovers around this level thanks to robust earnings and demand for its cloud and enterprise solutions, Apple has experienced more turmoil in recent time. In the first three months of this year, Apple shed nearly $1.5 trillion from its market capitalization amid trade tensions and concerns about slowing growth. During this bout of volatility, the company briefly became smaller than the U.S. small-cap equity universe, but a rally sparked by its announcement to bring manufacturing back to the U.S. helped Apple regain its footing and once again surpass the Russell 2000 Index in terms of market capitalization.

The meteoric rise of Apple, Microsoft, and NVIDIA underscores ongoing investor preferences for large-cap, technology-focused companies. In contrast, the U.S. small-cap space, which is more tilted toward businesses in sectors like Financials and Industrials, has struggled in recent years for this same reason. The Russell 2000 Index has also been negatively impacted by the realization of smaller company growth within private markets, as outlined in a recent newsletter. Going forward, investors should be cognizant of the risks posed by both large and small companies and remain adequately diversified across the market capitalization spectrum.

Treasury Market Creates a Balancing Act

Despite the U.S. economy’s impressive growth in recent decades, the federal government currently faces elevated borrowing costs to fund its persistent budget deficits. While current bid-to-cover ratios remain robust in absolute terms, a declining trend in shorter maturities could represent one early warning sign that the traditional investor base demand is waning.

This newsletter examines the Treasury’s challenge of balancing funding costs with market demand and potential fiscal and monetary policy implications.

Reversal of Fortune

The U.S. employment report released last Friday by the Bureau of Labor Statistics (“BLS”) painted a significantly weaker picture of the current labor market. While the domestic economy added roughly 73,000 jobs in July and the unemployment rate ticked up only slightly to 4.2%, the publication included the sharpest downward revisions to previously reported job growth statistics since the COVID-19 pandemic. Specifically, estimates for nonfarm payrolls in May and June were reduced by 260,000. A large share of this downgrade came from state and local government education payrolls, which initially appeared to drive job growth in June but accounted for roughly 40% of recent revisions according to Bloomberg.

Notably, revisions to payroll statistics throughout this year have been consistently downward, with job counts adjusted lower for every month in 2025 to this point. Economists attribute these adjustments to both seasonal recalculations and the growing challenge of lower response rates from surveyed businesses. Indeed, initial response rates to BLS surveys, which sat at around 70% before the pandemic, have slipped below 60% in recent months, which could reflect fatigue or waning trust in institutions on the part of participants. It is also important to note that the government agencies tasked with conducting surveys of businesses and consumers are operating under increasingly tighter budgets, making it more difficult to create an accurate representation of the economic landscape. For instance, the BLS recently disclosed that roughly 15% of the sample used to compile the consumer price index, a key inflation gauge, was suspended from collection due to resource constraints.

President Donald Trump was quick to respond to Friday’s jobs report, dismissing BLS Commissioner Erika McEntarfer and alleging that the publication was manipulated for political reasons. Additionally, Federal Reserve Governor Christopher Waller pointed to labor market data revisions as a key reason for his recent vote to lower interest rates. While the Fed ultimately opted to keep its policy rate unchanged at its July meeting, further deterioration of labor market data may require more expeditious easing from the central bank in the months ahead.

Non-U.S. Stocks: Currency Leads, Earnings Lag

There was a striking reversal in equity performance trends during the first half of 2025, with non-U.S. stocks outperforming their U.S. peers by a significant margin. Specifically, the MSCI ACWI ex-U.S. and Russell 3000 indices returned 17.9% and 5.8%, respectively, on a year-to-date basis through June 30. While it is unclear whether this shift is a temporary phenomenon or the unraveling of a multidecade pattern, a deeper exploration of year-to-date returns for various equity benchmarks may provide some answers. Notably, currency movements, particularly the weakening of the U.S. dollar, have played an outsized role in the returns of non-U.S. stocks this year, adding 14% and 9% to the total year-to-date returns of the MSCI Europe ex-UK and MSCI Japan indices, respectively. Multiple factors have contributed to this bout of dollar weakness, including uncertainty regarding tariffs, concerns about the U.S. fiscal deficit, and a growing global interest in diversifying into non-U.S. assets. European and Asian equities have benefitted from these dynamics, with both regions experiencing strong capital flows in the first half of the year. This helps explain the second-largest return driver for international equities in 2025: multiple expansion. Indeed, improving investor sentiment and capital inflows have recently propelled international equity valuations above their long-term averages. Pledges for increased defense spending and infrastructure development in Europe (as described in a recent Chart of the Week) are especially stoking enthusiasm among investors, with fiscal stimulus measures and rate cuts serving as additional sentiment tailwinds.

While the factors detailed above warrant excitement about non-U.S. equities, it is prudent to address the risks facing the asset class as well. To that point, a third takeaway from the return decomposition detailed above is what is nearly absent from the total return of Europe and Japan: meaningful earnings growth. While certain sectors of the non-U.S. market, such as Financials and Information Technology, have strong growth projections, broad earnings expectations are mixed, with European companies expected to report a 0.3% drop in earnings for the second quarter. In conclusion, there is certainly a case for optimism related to the prospects of non-U.S. stocks going forward, but it is important to underscore the importance of earnings growth as the key driver of long-term returns.

Looking Across the Capital Stack

Despite allocations to various segments of corporate capital structures, most balanced portfolios have a degree of overlap when it comes to sector exposure across equities and fixed income. Still, key differences across the sector exposures of the U.S. equity and corporate bond markets are worth detailing. The extent to which the S&P 500 Index, which serves as a representation of the domestic large-cap stock market, is exposed to the Information Technology space has been described at length, with that sector comprising roughly one-third of the benchmark. This reflects the growth-oriented nature of the equity landscape, which Information Technology and similar sectors (e.g., Communication Services) have dominated due to higher earnings growth and extremely positive sentiment. In contrast, the Bloomberg Investment Grade Corporate Bond Index maintains a 34% weight to the Financials sector, with relatively balanced exposure to spaces like Health Care (11%), Utilities (10%), and Communication Services (7%). This dynamic reflects the capital-intensive nature of these sectors, which are comprised of companies that tend to issue more debt and are considered safer from a credit perspective. Finally, the Bloomberg High Yield Corporate Bond Index is most exposed to the Consumer Discretionary (23%) and Communication Services (15%) spaces, which are more sensitive to economic cycles and, thus, typically offer higher yields to compensate for higher risk.

The varied sector exposures for these indices are reflected in historical return correlation data. On a since-inception basis, the S&P 500 Index has exhibited correlations of 0.40 and 0.63 with the Investment Grade Corporate Bond and High Yield Corporate Bond indices, respectively. These figures suggest that while equities and bonds can move together at times, the asset classes often behave differently. Importantly, these correlations are not static. Rather, they tend to rise during periods of market stress when asset classes often move in tandem due to broad risk-off sentiment. Under normal market conditions, however, the differences in the sector compositions of these indices allow for diversification benefits in a balanced portfolio.

By combining equities with both investment grade and high yield corporate bonds, investors gain exposure to a broader mix of U.S. businesses across sectors and asset classes. This dynamic can help market participants mitigate the impact of sector-specific downturns, making a balanced portfolio more resilient in varying economic environments.

2025 Halftime Market Insights

This video is a recording of a live webinar held July 17 by Marquette’s research team analyzing the first half of the year across the economy and various asset classes as well as themes we’ll be monitoring through the rest of 2025.


Our quarterly Market Insights series examines the primary asset classes we cover for clients including the U.S. economy, fixed income, U.S. and non-U.S. equities, hedge funds, real assets, and private markets, with commentary by our research analysts and directors.

Featuring:
Greg Leonberger, FSA, EA, MAAA, FCA, Partner, Director of Research
Frank Valle, CFA, CAIA, Associate Director of Fixed Income
James Torgerson, Senior Research Analyst
Catherine Hillier, Senior Research Analyst
David Hernandez, CFA, Director of Traditional Manager Search
Evan Frazier, CFA, CAIA, Senior Research Analyst
Dennis Yu, Research Analyst
Amy Miller, Associate Director of Private Equity
Chad Sheaffer, CFA, CAIA Senior Research Analyst

Sign up for research alerts to be invited to future webinars and notified when we publish new videos.

If you have any questions, please send our team an email.

Policy Uncertainty Blurs the Outlook

As we enter the second half of the year, Liberation Day-induced market volatility seems like a distant memory with the S&P hitting another all-time high on July 10th and non-U.S. stocks significantly outpacing their U.S. counterparts through June 30th. Meanwhile, the One Big Beautiful Bill was signed into law by President Trump on July 4th with varying expectations on its impact to growth but a consensus view that it will push the deficit higher.

In this edition:

  • Tariff and policy uncertainty
  • Risk factors and market indicators
  • Equity market drivers
  • Currency and regional trends
  • What to watch in the second half

Why Are Emerging Markets Investors Removing Their China Exposure?

Emerging markets (EM) equities have gone through cycles of performance throughout time, creating varied investor sentiment towards the asset class. Recently, discussions around excluding China from investment portfolios have become more common, spurring the growth of active EM ex-China strategies. This newsletter explores the current landscape of EM investing, examines the drivers of the EM ex-China trend, and analyzes the performance impact of removing China from an EM allocation.

Know Your Volatility

Fiduciaries, trustees, and institutional investors may be understandably puzzled by recent developments and shifts in tone from U.S. regulators and policymakers regarding digital assets. For those not following the space closely, in recent months:

  • The Department of Labor (DOL) rescinded its 2022 “extreme care” guidance and reaffirmed a neutral stance — emphasizing fiduciary process over product exclusion.2
  • Banking regulators softened their posture by withdrawing supervisory guidance, signaling a shift from structural resistance to conditional tolerance and constructive engagement.3,4,5
  • The SEC approved a diversified, multi-asset crypto ETF — marking a pivotal moment in U.S. regulatory acceptance and product offerings.6
  • At the federal legislative level, bipartisan efforts to codify dollar-backed stablecoins suggest the possibility of a broader strategy to reinforce U.S. monetary leadership in both digital finance and capital markets.7,8
  • At the state level, Texas and New Hampshire have enacted legislation to establish digital asset reserve funds or authorize their state treasurers to invest in digital assets.9

These developments may seem at odds with the long-standing perception that digital assets — particularly Bitcoin — are categorically too volatile and immature for institutional portfolios. While the immaturity label is fair and simply a function of time, the volatility story — while true on an absolute basis — loses a bit of its bite when compared to individual stocks.

The chart above illustrates this point using securities from the S&P 500 (blue) and Russell 2000 (light blue) — benchmarks that underpin equity exposures across many investment portfolios. Since 2020, more than 1,000 individual stocks (purple) included in core S&P 500 and Russell 2000 indices have, on average, exhibited annualized volatility comparable to or exceeding that of Bitcoin — including well-known names such as Tesla, Nvidia, Carvana, Hims & Hers, and JPMorgan Chase.¹ While this is not to suggest Bitcoin’s price should be expected to follow the same price movements of a traditional stock, it does start to address the long-held stereotype of its outsized volatility across market cycles. That said, the relative immaturity of Bitcoin (and all digital assets for that matter) should be considered when assessing the relative volatility versus stocks.

Ultimately, the intent here is not to advocate adoption — this is not an endorsement of digital assets. Rather, the goal is to better understand that recent regulatory, policy, and institutional shifts appear to reflect a more empirically grounded understanding of risk.

It is important to underscore that many of these developments remain provisional. Absent more binding legislation, recent guidance and positions could shift under future administrations. Accordingly, Marquette maintains a cautious approach to digital assets. Fiduciary prudence requires a holistic, portfolio-based risk assessment that considers formal legislation and regulatory frameworks, governance standards, plan-specific objectives, and long-term suitability. Fiduciaries require a durable foundation for evaluating potential portfolio inclusion of asset classes. Given the inherent uncertainty of a transient regulatory landscape — and the varied facts and circumstances across retirement plans — a measured, wait-and-see approach seems reasonable.

1 Bloomberg 260-day volatility as of May 30, 2025; 260-day historical volatility for all assets, respectively.
2 U.S. Department of Labor, Employee Benefits Security Administration. Compliance Assistance Release No. 2025-01: 401(k) Plan Investments in “Cryptocurrencies”. May 28, 2025.
3 Board of Governors of the Federal Reserve System. Federal Reserve Board Announces Withdrawal of Guidance for Banks Related to Crypto-Asset and Dollar Token Activities. Press release, April 24, 2025.
4 Federal Deposit Insurance Corporation. FDIC Clarifies Process for Banks to Engage in Crypto-Related Activities. Press release, March 28, 2025.
5 Office of the Comptroller of the Currency. OCC Clarifies Bank Authority to Engage in Crypto-Asset Custody and Execution Services. Interpretive Letter #1184, May 7, 2025.
6 U.S. Securities and Exchange Commission. Order Granting Accelerated Approval of a Proposed Rule Change, as Modified by Amendment No. 1 Thereto, to Amend NYSE Arca Rule 8.500-E (Trust Units) and to List and Trade Shares of the Grayscale Digital Large Cap Fund LLC under Amended NYSE Arca Rule 8.500-E (Trust Units). Release No. 34-103364, July 1, 2025.
7 Reuters. U.S. Senate Passes Stablecoin Bill in Milestone for Crypto Industry. June 17, 2025.
8 Bloomberg Government. Texas Gov. Abbott Signs Bill to Create State Bitcoin Reserve. July 1, 2025.
New Hampshire General Court. House Bill 302: An Act Relative to Enabling the State Treasury to Invest in Precious Metals and DigitalAssets. Signed May 6, 2025. Effective May 7, 2025.

One Big Beautiful Bill Act: Excise Tax Changes Legislative Update

The One Big Beautiful Bill Act was passed by Congress and signed into law by President Donald Trump on July 4, 2025. The legislation includes significant updates to the excise tax structure on net investment income of certain educational institutions, with direct implications for private colleges and universities related to their endowments.

This legislative update addresses considerations for investors regarding:

  • Changes to the current excise tax for private colleges and universities
  • Private foundation excise tax
  • Scrutiny of tax-exempt debt issuance
  • Reinstatement of a universal charitable deduction