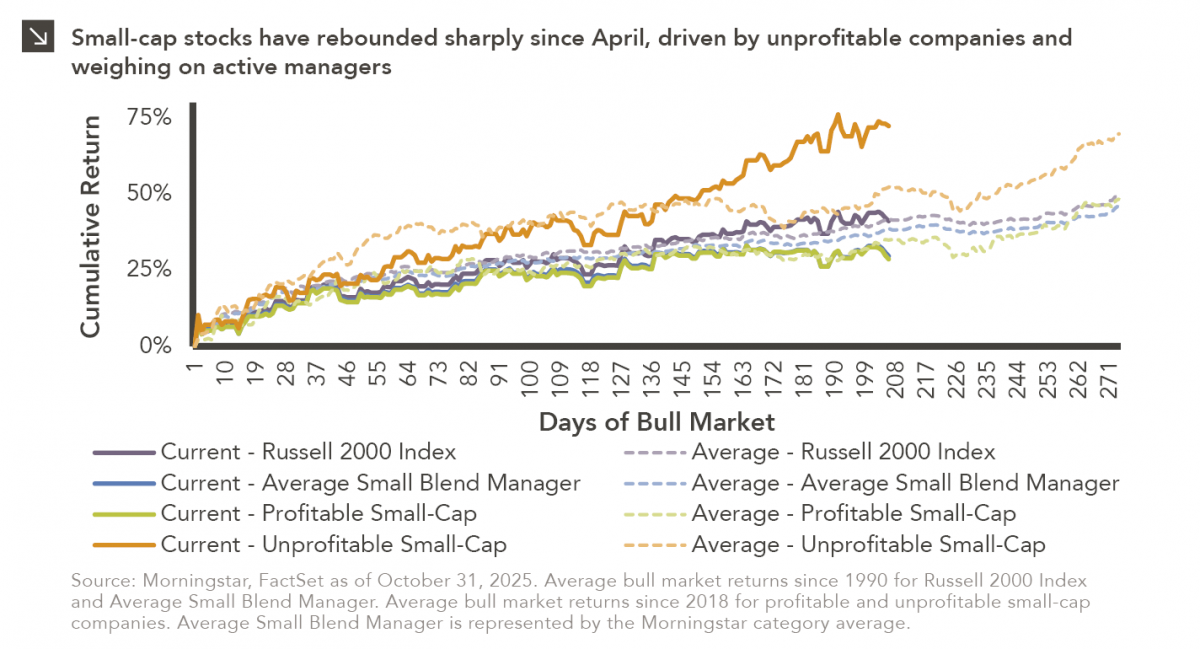
2025 Investment Symposium

Watch the flash talks from Marquette’s 2025 Investment Symposium livestream on September 26 in the player below — use the upper-right list icon to access a specific presentation.


Please feel free to reach out to any of the presenters should you have any questions.

The Divided States of ESG

Trifecta status for a state exists when a single political party holds the governor’s seat and a majority in both chambers of the state legislature. In terms of Environmental, Social, and Governance (ESG) investing, most Republican trifectas and states with divided governments have enacted legislation opposing ESG measures in recent years, while Democratic trifectas have passed bills in favor of ESG. Specifically, 36 states have passed a total of 127 bills either supporting or opposing ESG initiatives since 2020. At the time of their enactment:

  • 60% of the bills were in opposition to ESG and from a Republican trifecta state
  • 25% of the bills were in support of ESG and from a Democratic trifecta state
  • 12% of the bills were in opposition to ESG and from states with a divided government

While the darkest shades of blue and red in this week’s chart represent the states with the highest number of enacted ESG bills, it is interesting to note that the states represented by the lightest shade of blue (CT, NJ, NM, NY, WA) are Democratic trifecta states that have not passed any ESG bills to date. Readers should also note that ESG investing is federally regulated by the Department of Labor and the Securities and Exchange Commission, with strict disclosure requirements for investment managers to substantiate any ESG-related claims.

Future ESG legislation will likely vary on a state-by-state basis based on political leadership, making upcoming elections particularly relevant. Election outcomes in politically divided states that have yet to adopt any ESG bills will be especially noteworthy when it comes to gauging sentiment. Upcoming gubernatorial races with potential ESG implications include New Jersey and Virginia later this year, as well as Alaska, Arizona, Michigan, Nevada, Vermont and Wisconsin in 2026.

The Running of the Bulls

Barring a significant equity market drawdown in the coming weeks, the current bull market will turn three years old in October. The gains posted by the S&P 500 Index during this time have certainly been robust, with the benchmark delivering 24% and 36% returns in the first and second 12-month periods of the current bull market, respectively. This strong performance has led many investors to question if stocks will continue to deliver in the near future. Interestingly, bull markets in decades past have seen positive stock returns well into the third, fourth, and fifth years; however, these gains tend to be more muted than those notched in the first two years. Over the last 50 years, the pattern has often been the following:

  • Year one: Explosive gains are recorded as markets rebound from oversold conditions. The average return of the S&P 500 Index in the year after a bear market trough is roughly 37%.
  • Year two: Equity returns are still strong but less extreme, with the S&P 500 Index averaging a return of 17%. Earnings growth and investor confidence begin to stabilize.
  • Years three–five: Equity momentum slows. Average returns compress to 8%–13% and markets become more vulnerable to corrections.

To expand on the final bullet point, the third, fourth, and fifth years of a bull market often prove shakier given the convergence of several structural factors. For instance, early in the cycle, central banks and governments typically provide aggressive stimulus to allow markets to recover from troughs; however, inflation and financial stability risks typically arise within a few years. These factors usually prompt tightening from policymakers, which can constrain equity performance. At the same time, the sharp rebound in corporate profits that characterizes the first two years begins to normalize, making year-over-year comparisons less favorable. Valuations, which tend to increase in the early innings of a bull market as confidence returns, also usually peak around year three. This causes any future stock gains to be more dependent on genuine fundamental improvements (i.e., earnings growth) rather than continued multiple expansion. Finally, after two years of strong performance, investor sentiment often shifts from optimism to caution, with growing fears that current conditions may not persist. While it is impossible to predict the trajectory of equity markets from here, it may be prudent for investors to expect more muted gains from stocks in the years ahead simply based on historical patterns.

Oil Pressure?

Earlier this year, Marquette published a Chart of the Week that detailed the muted change in oil prices in the aftermath of U.S. strikes on Iranian nuclear facilities. Tensions in the region have persisted in recent time, with last week seeing Israeli airstrikes that targeted Hamas leadership in Qatar. In response to this development, oil ticked higher as investors assessed the increased risk of commodity supply chain disruptions but later gave back most of these gains. This represents a continuation of the trend exhibited during most of 2025, in which geopolitical shocks do not materially increase the price of oil. One possible explanation for this dynamic would be persistently elevated supply of the commodity.

As displayed in the chart above, there has been a sustained imbalance between oil supply and demand for most of the last six months, with supply outpacing demand. Indeed, OPEC+, which includes the Organization of Petroleum Exporting Countries, Russia, and other allied producers, has moved to aggressively raise output in 2025, which has resulted in a production capacity increase of over two million barrels per day since April. Despite this already increasing supply, OPEC+ recently made an agreement to add an additional 137,000 barrels per day to its production capacity in October. These increases in capacity have significantly outpaced global demand, driving prices lower and widening the oil supply glut. Going forward, while geopolitical instability may support temporary price increases, the longer-term outlook for oil remains clouded by excess supply and uncertainty surrounding future consumption of the commodity.

Getting That Paper

Commercial paper is a type of unsecured debt instrument that can be utilized by companies to finance short-term liabilities. The U.S. commercial paper market, which eclipsed $2 trillion in total value in 2007, was decimated in the aftermath of the Global Financial Crisis, with ultra-low interest rates pushing most companies toward longer-term obligations. That said, this method of financing is currently experiencing a revival, as 2025 has seen more than $200 billion in new U.S. commercial paper issuance. This is the highest figure notched in a calendar year since 2006. Indeed, major corporations including Uber, Netflix, Coca-Cola, PepsiCo, Philip Morris, and Honeywell have recently ventured into the commercial paper market, collectively raising billions through instruments that usually mature within one to three months. Total U.S. commercial paper outstanding stood at more than $1.4 trillion at the end of August.

The recent growth of the commercial paper market reflects a notable change in how U.S. companies are choosing to finance operations. With borrowing costs elevated and trade tensions persisting, firms have opted to bolster cash reserves while avoiding the higher expense of long-term debt, particularly as potential interest rate cuts from Federal Reserve loom. This trend is consistent with the approach of the U.S. Department of the Treasury, which has relied heavily on short-term T-bill issuance to cover government funding needs. It is important to note, however, that commercial paper utilization exposes issuers to certain risks. For instance, if long-term interest rates remain high, companies could be forced to regularly roll over short-dated obligations. A surge in short-term borrowing by both businesses and the government may also increase competition for investors, raising funding costs further.

What’s It All Worth?

In private markets, secondary transactions have increasingly gained attention and acceptance as a viable liquidity option for both general partners (“GPs”) and limited partners (“LPs”). During the first half of 2025, secondary market volume reached record levels, surpassing $100 billion for the first time in history. Specifically, volume totaled $102 billion in the first six months of the year, with a nearly even split between LP-led (53%) and GP-led (47%) transactions. To put this in perspective, secondary transaction volume for the entirety of 2022 was $103 billion. Although dry powder has declined in recent months — from $216 billion in 2024 to $171 billion — fundraising is expected to more than offset this decrease, with $218 billion projected to be raised over the next year.

As is common with most asset classes, increased market participation leads to more capital being raised and deployed, which, in turn, drives asset prices higher. The secondary market follows this same trend. Typically, secondary transactions are priced at a discount to the net asset value (“NAV”) of the assets or stakes being sold. However, secondary pricing across all private asset classes increased in 2024, reaching 89% of NAV (up from 85% in 2023). Buyout secondaries saw the highest pricing last year, trading at 94% of NAV, while pricing of private debt secondaries jumped from 77% of NAV in 2023 to 91% in 2024. In contrast, real estate secondaries traded at the lowest percentage of NAV, settling at 72% in 2024. This figure is more consistent with the 71% trading value exhibited by real estate secondaries in 2022 and 2023.

This brings us to the central question of this piece: What’s it all worth? Simply put, whatever someone is willing to pay! But how do we value an asset purchased at a discount? Can we trust the original valuation? Historically, secondary buyers have tended to mark acquired assets up relative to the previous owner’s NAV shortly after the transaction closes, but is this a fair and accurate way to value an asset? If buyers conduct thorough due diligence, their own assessments of a company or portfolio will inform their willingness to pay market-clearing prices, meaning pricing is not determined solely by the current value of an asset. Indeed, buyer perspectives on future growth potential, exit opportunities, and comparable market transactions all influence secondary market pricing. Additionally, recent strong capital inflow for the asset class may be putting pressure on acquirers to put money to work, potentially contributing to the recent uptick in pricing.

The Day Credit Spreads Died

July 31, 1997 is a date which will live in infamy. On this day, FedEx Express Flight 14 crashed at Newark International Airport, baseball slugger Mark McGwire was traded from the Oakland Athletics to the St. Louis Cardinals, and the Lehman Corporate Index hit an all-time tight of 51 basis points. While not quite at all-time tight levels, credit spreads are currently partying like it’s (almost) 1999. Specifically, the Bloomberg Corporate Index, the successor to the Lehman Corporate Index, sat at 75 basis points as of August 22, 2025, the lowest level in more than 25 years. And you may ask yourself: “Well, how did I get here?”

Tight credit spreads generally indicate that investors see less risk in the market relative to government bonds, and current spreads can be examined using a combination of macroeconomic, fundamental, and technical factors. On the macroeconomic front, tariff-related volatility in the first half of 2025 caused spreads to widen, but this widening was followed quickly by a return to lower levels given progress with trade negotiations. Additionally, a strong second quarter GDP figure and moderating inflation have provided a strong backdrop for credit. When it comes to fundamentals, credit also appears healthy. The COVID-19 pandemic gave companies the opportunity to strengthen balance sheets by terming out debt at low interest rates, while corporate earnings remain favorable. With more than 92% of S&P 500 Index constituents reporting, expectations are for EPS growth of roughly 11% for the benchmark in the second quarter (on a year-over-year basis). This figure far exceeds the consensus pre-earnings estimate of 5%. Higher coverage ratios, combined with leverage ratios that have fallen significantly since the Global Financial Crisis, creates a solid fundamental backdrop for credit. Finally, on the more technical side, strong demand for risk assets has stretched valuations, and the correlation between fund inflows and credit spreads is very high. Indeed, as most bond investors are yield buyers, higher base rates have made the fixed income space more attractive, and this dynamic has pushed spreads tighter.

In conclusion, a solid macroeconomic background, strong fundamentals, and technical factors have driven credit spreads to near historic tights. Barring an exogenous market shock, spreads may remain tight in the coming months, meaning investors should exercise caution when it comes to credit given the little room for error conditions currently provide.

The Impact of Artificial Intelligence on Markets

Over the last several decades, artificial intelligence (“AI”) has evolved from a theoretical concept into a transformative force across a variety of industries. The 1940s saw the advent of the digital computer, which was followed years later by the first artificial neural network, a computational model inspired by the structure of the human brain that consists of algorithms that attempt to recognize relationships in data. In more recent years, researchers have developed “deep learning” systems (i.e., neural networks with many layers) capable of increasingly complex tasks including image recognition, reading comprehension, and predictive reasoning. Given the advances in the space, it should not come as a surprise that the use cases of artificial intelligence are now vast, with AI tools now implemented across fields including health care, retail, finance, and entertainment. Researchers and corporate executives are not the only ones to have noticed the remarkable potential of AI, however, as investors have flocked to the space in droves over the last several years.

This newsletter outlines the growth of AI as an investment theme, including performance, valuations, and earnings growth of AI-related companies and equities, other segments of the market that may stand to benefit from advances in AI, and potential risks for investors.

Alternatives in Defined Contribution Plans

On August 7, 2025, President Trump signed an executive order to expand alternative investment access in defined contribution retirement plans (e.g., 401(k) plans). This order instructs the Department of Labor (DOL) to reexamine its guidance to plan sponsors incorporating alternative investments into these types of retirement plans. According to the order, the six classes of alternative assets included are:

  • Private markets investments, including private equity and private debt
  • Real estate
  • Actively managed vehicles investing in digital assets
  • Commodities
  • Infrastructure
  • Lifetime income strategies, including longevity risk-sharing pools

All Eyes on Jackson Hole

Predictions that the Federal Reserve is set to lower interest rates will be put to the test this week as Chair Jerome Powell prepares to outline his view of the economy at the central bank’s annual symposium in Jackson Hole, Wyoming. Most anticipate a more dovish tone from Powell in his remarks on Friday due to weakening labor market dynamics, though recent inflation figures have tempered some of that optimism. While a monetary policy decision will not be made at the Jackson Hole symposium, Powell’s comments are sure to provide insight into what might occur at the Fed’s September meeting, at which there is an 85% chance of a 25 basis point rate cut according to prediction markets. All told, the central bank has three remaining opportunities to make changes to its policy rate in 2025.

Comments from Fed chairs at Jackson Hole have proven significant in the past. For instance, Powell warned that controlling inflation would require economic pain in his speech three years ago, and these remarks sent short-term yields higher. Additionally, at last year’s symposium, he indicated that the Fed was prepared to lower borrowing costs from multi-decade highs, triggering a sharp drop in both the 2- and 10-year Treasury. Yields have retreated across most maturities in recent weeks following a lackluster July jobs report, with the 2-year yield now hovering around 3.75%, meaning a material reaction to Powell’s speech could send short-term yields to multi-year lows.

In the weeks ahead, attention will shift from Jackson Hole to the August jobs report, which could solidify expectations for an interest rate reduction in September. Investors should note, however, that monetary easing would come at a time when inflation remains above target and fiscal stimulus from the Trump administration’s recent spending package looms large. Those dynamics, combined with concerns about political interference at the Fed and recent changes in leadership at the Bureau of Labor Statistics, could lead investors to demand higher compensation for holding longer-dated Treasuries.