The Implications of a Stronger Dollar on Emerging Market Investments

In 2015, the emerging market equity index declined 14.9%. While there are a variety of explanations for this, one can not underestimate the impact of a stronger dollar. In fact, currency losses were responsible for more than 60% of the decline for U.S.-based investors.

In 2015, the emerging market equity index declined 14.9%. While there are a variety of explanations for this, one can not underestimate the impact of a stronger dollar. In fact, currency losses were responsible for more than 60% of the decline for U.S.-based investors. This week’s chart of the week examines the mechanics of how a stronger dollar can drive losses for emerging market investments.

Typically when U.S. interest rates rise, the dollar strengthens relative to foreign currencies. Investors oftentimes onshore investments during rising rate periods, and as a result, the country as a whole “exports” less dollars. The commodity price declines — especially oil — have been a major contributor to the rise in the U.S. dollar as the U.S. exports fewer dollars per unit. In our chart, we use the quantity of oil imported multiplied by its price as a proxy for the amount of dollars exported each month. During 2014, the United States imported an average of $26 billion a month in oil. During the first ten months of 2015, the U.S. imported an average of $14 billion a month, clearly a large drop and in conjunction with dollar strengthening and emerging market equity declines.

So why do emerging market investments fall? Emerging market economies often depend on dollar-denominated revenues to service debts as well as manage interest rates and exchange rates. If emerging market countries are receiving less dollars from the U.S., they face increased pressures from higher borrowing costs and lower dollar-denominated revenues. In addition, with less revenue, it is more difficult to promote internal growth via exchange rates or interest rate policies. Unfortunately, as U.S. interest rates are poised to rise further in 2016, emerging markets are likely to experience heightened volatility as a result.

Divergent Central Bank Policy

This week’s Chart of the Week shows the divergence in Monetary Policy from the ECB, Bank of Japan and Federal Reserve. The Federal Reserve discontinued its quantitative easing (“QE”) strategy October 29th 2014; in contrast, after the end of 3Q14, the Bank of Japan and European Central Bank have increased asset holdings 30% and 26%, respectively.

This week’s Chart of the Week shows the divergence in Monetary Policy from the ECB, Bank of Japan, and Federal Reserve. The Federal Reserve discontinued its quantitative easing (“QE”) strategy on October 29th, 2014; in contrast, after the end of 3Q14, the Bank of Japan and European Central Bank have increased asset holdings by 30% and 26%, respectively.

During the same time period, the Euro and Yen have depreciated by over 10%, now trading at approximately 85% of their 10-year averages. The Bank of Japan and European Central Bank will continue large asset purchases for the foreseeable future in an effort to reduce borrowing costs and stimulate growth.

In the short term, foreign multinational corporations should utilize suppressed borrowing costs and weaker currencies as tailwinds for exports. This is best explained by third-party consumers’ attraction to the Eurozone and Japan’s relative prices of goods. QE’s goal to stimulate economic growth has had positive externalities on each bank’s respective currency; over the long run, the currency effect should be normalized as foreign direct investment is attracted to higher revenues and profits, yielding currency demand.

The Eurozone growth estimate of 0.3% advocates further action will be taken by the ECB through QE. Increased stimulus levels will force the Euro towards parity with the dollar for the first time in over a decade. Until there are better signs of growth from Eurozone nations, the ECB will be forced to use monetary stimulus and currency demand will continue to decline.

Asset Class Review: What Has Worked So Far in 2015?

This week’s chart shows broad asset class returns through July 31st of this year. Perhaps the most surprising performer has been international equity, which has outperformed even U.S. equities. Much of the outperformance is due to the strong U.S. dollar, which has increased international developed countries’ exports and the number of tourists.

This week’s chart shows broad asset class returns through July 31st of this year. Perhaps the most surprising performer has been international equity, which has outperformed even U.S. equities. Much of the outperformance is due to the strong U.S. dollar, which has increased international developed countries’ exports. The same factor has in turn contributed to the lower performance of U.S. equities. With so many of the S&P 500 companies’ revenues dependent on international growth (about 46%), the strong dollar has weighed heavily on EPS growth. In addition, the same factors many of our readers have heard before — the slowdown in the energy sector and the cold winter — have also played major roles.

The other darling this year, as widely predicted, has been Real Estate. Throughout the first half of the year, growth has in large part been due to income, lease turnover, and appreciation (most notably in the Southwest U.S.). The remainder of the year is likely to see less contribution from income and more contribution from appreciation.

Now let us turn to the poor performers. Bonds, both Global and U.S., continue their same old story: the specter of the Fed rate hike continues to loom, in addition to the Greek debt crisis and China’s now not-so-secret efforts to prop up growth. Emerging Markets have been the worst performers this year, thanks in large part to their dependence on commodities and the domino effect of China’s slowing growth which has translated into weakening currencies.

Where will the rest of the year take us? As the issues we have discussed will continue to weigh on asset classes, it will not be surprising if meandering to disappointing returns across asset classes continue for the rest of 2015.

1 Real Estate Returns through 6/30/15; Private Equity Returns through 3/31/15

Time to Buy U.S. Small-Cap Value Stocks?

Through the first seven months of 2015, growth stocks have far outpaced their value brethren in the U.S. equity market. While the theme has played out across all size sectors of the market, this trend has been most obvious for small-cap stocks.

Through the first seven months of 2015, growth stocks have far outpaced their value brethren in the U.S. equity market. While the theme has played out across all size sectors of the market, this trend has been most obvious for small-cap stocks. The Russell 2000 Growth index has returned 9.18% while the Russell 2000 Value index has dropped 2%. Given this disparity, it is worth examining whether now is an appropriate time to re-allocate to small-cap value stocks, since their recent struggles have driven prices lower. To help answer this question, we turn to a comparison of the current index price versus its 200-day average, a common valuation metric used to measure the relative value of a particular stock or index versus a longer-term average. As shown in the chart, the index dipped below its 200-day trading average in July and is now trading at a discount relative to its historic values.

From the broader perspective of portfolio construction, small-cap value stocks have historically offered upside potential and outperformance versus other style and size sectors in the U.S. equity market. In addition, since smaller companies’ operations tend to be more domestically focused, they could potentially provide a sanctuary from the rough geopolitical turmoil that is occurring in Europe and Asia. On a related note, the potential drag from a stronger U.S. Dollar would also be muted due to small-cap companies’ limited international exposure. Given the long-term benefits of small-cap value stocks along with the current valuation of the index, now may be an attractive opportunity to either rebalance or create exposure to the asset class.

International Equity Returns vs. Strong Dollar

A major concern for investors over the last year has been the impact of a stronger dollar on international equity returns. Generally speaking, a stronger dollar translates to lower returns for international equity investments, and in 2014 the currency effect on the EAFE index was -10.9%, a sizable reduction to returns for U.S.-based investors.

A major concern for investors over the last year has been the impact of a stronger dollar on international equity returns. Generally speaking, a stronger dollar translates to lower returns for international equity investments, and in 2014 the currency effect on the EAFE index was -10.9%, a sizable reduction to returns for U.S.-based investors. On the other hand, valuations for international equities – especially those in Europe – appear far more attractive relative to levels in the U.S., and suggest higher upside potential, with the ECB’s asset purchase program offering further upside for European equities.

To date, how has this dynamic played out? Have the compelling valuations abroad been more than offset by the currency drag from the dollar’s strength? Our chart this week examines these very questions, looking at year-to-date performance for major markets and regions. Perhaps not surprisingly, Eurozone equities show the largest downward adjustment as a result of exchange rates, while Japan and China show little to no difference between local and dollar-denominated returns. After the first quarter, international equities have outperformed their U.S. counterparts in 2015 and rewarded investors who were patient with their non-U.S. equity allocations. Though it has only been one quarter, this is a theme that may persist for the better part of the year, as the dollar is still stronger than its historical average versus the Euro, and equity valuations are suppressed relative to those in the U.S.

Europe’s QE: Better Late than Never?

The European Central Bank (ECB) announced Thursday it will begin a quantitative easing (QE) program in which it will buy €60 billion worth of assets a month. The program, which will commence in March and continue through September 2016, will purchase both government and private sector bonds as well as other institutional debt securities. This move comes after the U.S. and U.K. have ended their own QE programs following declining unemployment and modest GDP growth.

The European Central Bank (ECB) announced Thursday it will begin a quantitative easing (QE) program in which it will buy €60 billion worth of assets a month. The program, which will commence in March and continue through September 2016, will purchase both government and private sector bonds as well as other institutional debt securities. This move comes after the U.S. and U.K. have ended their own QE programs following declining unemployment and modest GDP growth.

Though there are a wide variety of opinions on the effectiveness — and consequences — of QE, the ECB hopes it will be the economic jump start that many of the countries in the Eurozone desperately need. The most recent GDP growth for the region was 0.8%, while unemployment was 11.5%. Additionally, the latest IMF forecast gave the Euro Area a 38% chance of falling into another recession. But the most troubling issue for the Eurozone is its inflation rate, which fell to -0.2% in December. Deflation can make it more difficult to pay back debt, which is especially worrisome for countries such as Greece, Italy, and Spain that have debt exceeding 100% of GDP. If the ECB is successful in achieving its 2% target inflation, this, in theory, would lead to further devaluation of the Euro, which has already fallen over 17% against the U.S. dollar since the start of last year.

How QE will affect the different parts of the Eurozone is difficult to predict. Unlike other QE programs, this one spans multiple countries and banking systems, some of which are opposed to this monetary policy. Stronger economies, such as Germany, warn that this shouldn’t be used as a method to avoid structural reforms while others feel the move was long overdue. Either way, with the threat of a third recession since 2008 looming, Europe appears to be left with little choice.

Real Assets: The State of Commodities

December 2014 Investment Perspectives

Commodity market investors received a ray of hope in the early months of 2014. After several years of consecutive declines, commodities, as measured by the Bloomberg Commodity Index, began the year on strong footing and posted a gain of 7.1% in the first half of the year. By the end of the third quarter, however, commodities entered negative territory, and the year-to-date return through November for the Bloomberg Commodity Index had fallen to -10.2% (Exhibit 1). In this newsletter, we examine the recent developments in the commodity markets and evaluate their prospects for the coming quarters.

Download PDF

Currency Effects on International Equity Returns

One of the most significant challenges that international equity investors have faced this year is the impact of a stronger dollar. From many perspectives, a stronger dollar signals improved economic growth in the U.S. Unfortunately, a stronger dollar also acts as a headwind for U.S.-based investors purchasing international equities.

One of the most significant challenges that international equity investors have faced this year is the impact of a stronger dollar. From many perspectives, a stronger dollar signals improved economic growth in the U.S. Unfortunately, a stronger dollar also acts as a headwind for U.S.-based investors purchasing international equities. In some instances, the impact of the stronger dollar has flipped positive returns denominated in local currency to negative returns when translated to U.S. dollars. In fact, this phenomenon has occurred year to date in 2014: the local currency return for a primary international equity index (MSCI EAFE) is positive (red bar; 4.2%), but becomes negative when denominated in dollars (blue bar; -2.4%).

In our Chart of the Week, we examine the retrospective returns of the MSCI index, denominated in both local currency and U.S. dollars. Based on the chart, two conclusions seem straightforward:

  • The “winner” each year will vary over time, which is not surprising since the U.S. dollar strengthens in some years and weakens in others.
  • Over the long term, the relative strengthening or weakening of the U.S. dollar is more or less balanced out, as the cumulative returns of each index – local and dollar – suggest, shown by the convergence of the two cumulative return streams.

If nothing else, this week’s chart should provide some comfort to investors whose returns have been negatively impacted by a stronger dollar: although the dollar acted as a drag on international returns this year, it is highly unlikely this will be a consistent pattern in the coming years, and should certainly not serve as a worry for long-term international equity investors.

Emerging Markets Debt a Better Play than Developed Market Debt

Emerging markets debt (“EMD”) represents an outstanding asset class for investors to diversify away from U.S.-centric core bonds, which includes U.S. Treasury, U.S. investment grade corporate and U.S. mortgage-backed bonds, as well as U.S.-centric bank loans and high yield bonds.

Emerging markets debt (“EMD”) represents an outstanding asset class for investors to diversify away from U.S.-centric core bonds, which includes U.S. Treasury, U.S. investment grade corporate and U.S. mortgage-backed bonds, as well as U.S.-centric bank loans and high yield bonds. It gives investors a large and expanding investment opportunity set that has very low correlation with U.S. equities and U.S. bonds.

In addition to stronger yields, where EMD is currently between 6% to 10% versus developed market bond yields between 0% to 6%, emerging markets also exhibit much stronger fundamentals versus their developed markets counterparts. Case in point, GDP growth has been much stronger in the emerging world than the developed world, especially so in the last few years, and is expected to continue for some time. Moreover, demographics are much more favorable for the emerging world, where population growth, especially in the younger, working segment, is expected to outstrip the developed world for quite some time. Lastly, as shown above, emerging market countries have much stronger debt and deficit profiles than developed market countries.

The left axis shows the debt as a percentage of GDP. The greater a country’s debt, the further towards the bottom of the chart it will show. The top axis shows the country’s fiscal deficit as a percentage of its GDP. The greater a country’s fiscal deficit, the further to the right it will show.

Emerging market countries are clustered toward the top left, due to their lower debt-to-GDP ratios and lower fiscal deficits. Developed market countries are clustered towards the bottom right, due to their higher debt-to-GDP ratios and higher fiscal deficits. Greece and Japan are in especially dire straits, and are literally off the charts.

What this chart tells us is that, as a whole, EMD represents a relatively secure asset class as the countries in question have much less debt to service than their developed market counterparts. In addition, they have been more fiscally sound, with lower deficits than their developed market counterparts. All of this adds up to strong support for emerging market countries and corporations to pay both the interest and principal on their bonds. Couple this with their higher yields and low correlations to other asset classes, and it makes it a must-have for most institutional portfolios.

Investors can take advantage of this space through a dedicated emerging markets debt manager that provides a U.S. dollar-denominated “hard currency” sovereign EMD focus, a “local currency” sovereign EMD focus, a corporate EMD focus, or a blended strategy that invests in both hard and local currency EMD bonds as well as sovereign and corporate EMD bonds. Marquette recommends a blended EMD allocation for investors to take advantage of the broadest diversification.

The Fragile Five

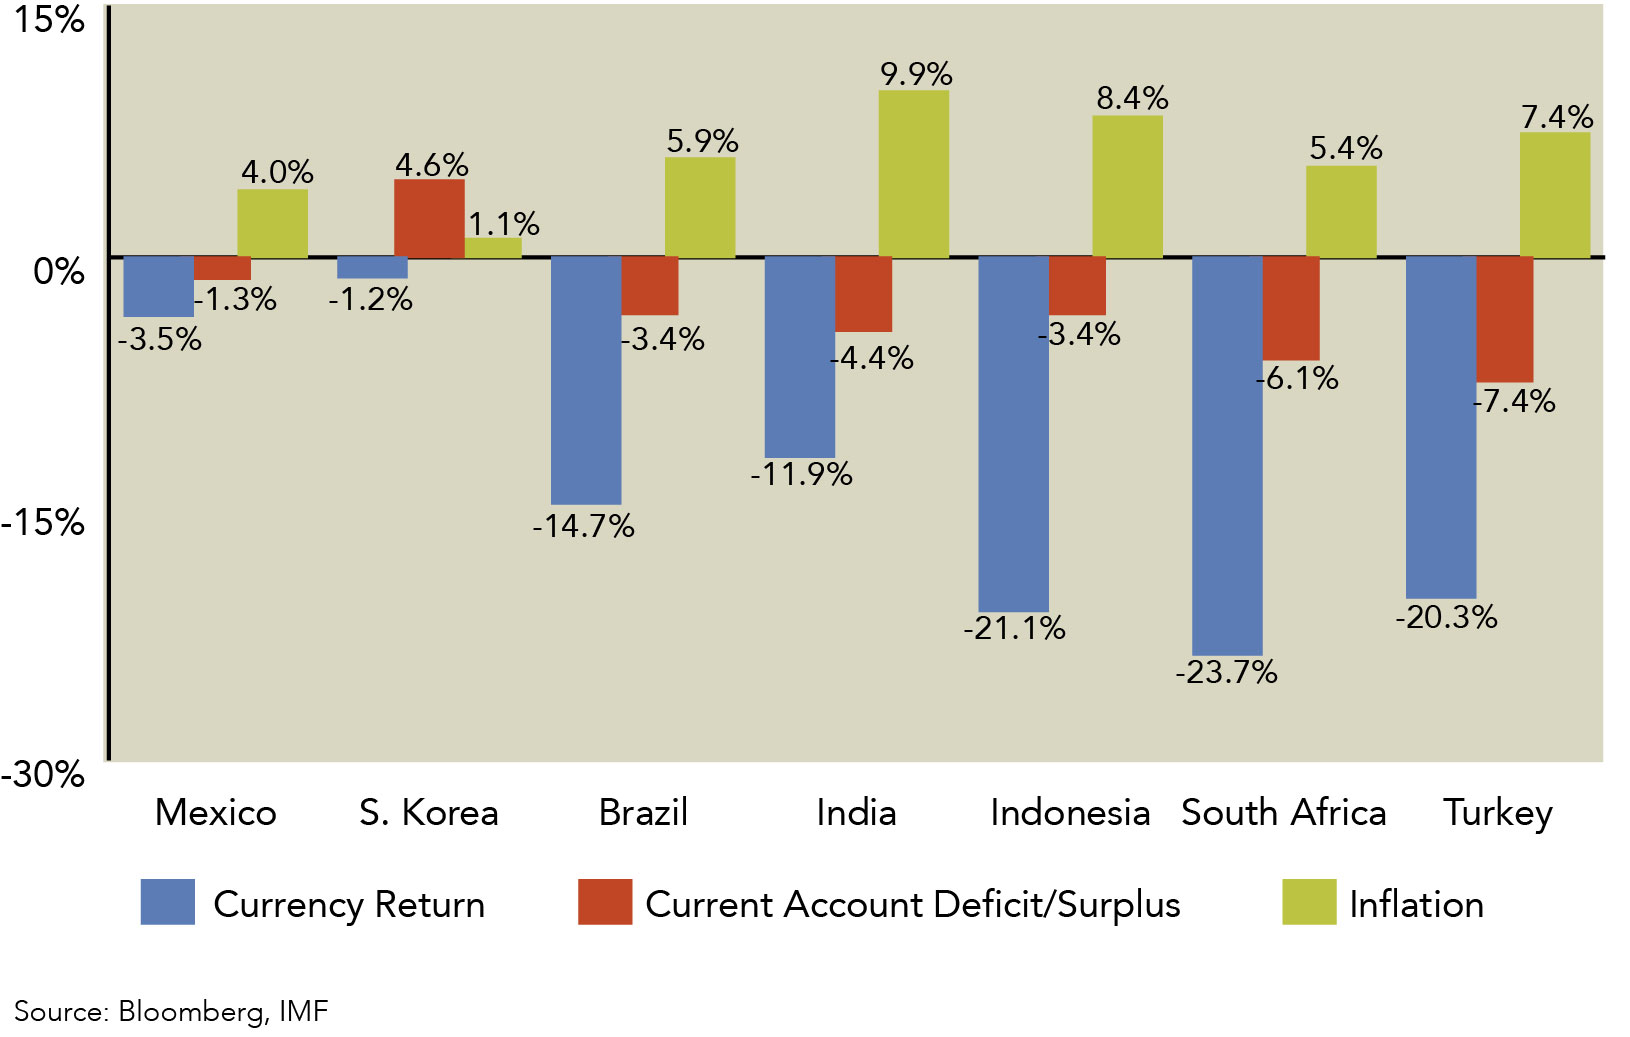
Given the continued poor performance of emerging market (“EM”) investments, this week’s chart examines the structural issues challenging a number of EM countries, namely the “fragile five” (Brazil, India, South Africa, Turkey, and Indonesia). The chart illustrates how countries with high inflation and large current account deficits have seen their currencies decrease dramatically against the U.S. dollar.

Given the continued poor performance of emerging market (“EM”) investments, this week’s chart examines the structural issues challenging a number of EM countries, namely the “fragile five” (Brazil, India, South Africa, Turkey, and Indonesia). The chart illustrates how countries with high inflation and large current account deficits have seen their currencies decrease dramatically against the U.S. dollar. In comparison the currencies of Mexico and South Korea have remained relatively resilient.

As liquidity is gradually withdrawn from the global economy, these structural issues within emerging markets have come to the forefront. Investors are concerned that after years of expansion and unlimited access to cheap capital despite poor policy fundamentals, these EM countries will have a very difficult time implementing the necessary structural reforms, while also maintaining strong growth.

In response, central banks of all the fragile five countries have taken decisive action and increased their benchmark interest rates within the last four months. Furthermore, due to emerging markets’ continued weak performance, valuations are not only attractive for the asset class as a whole, but more importantly for stronger and more stable EM countries such as Mexico and South Korea. While there is still policy and political uncertainty affecting emerging markets, there is no doubt that value is present in the asset class.

*Currency return from January 1, 2013 to February 4, 2014.