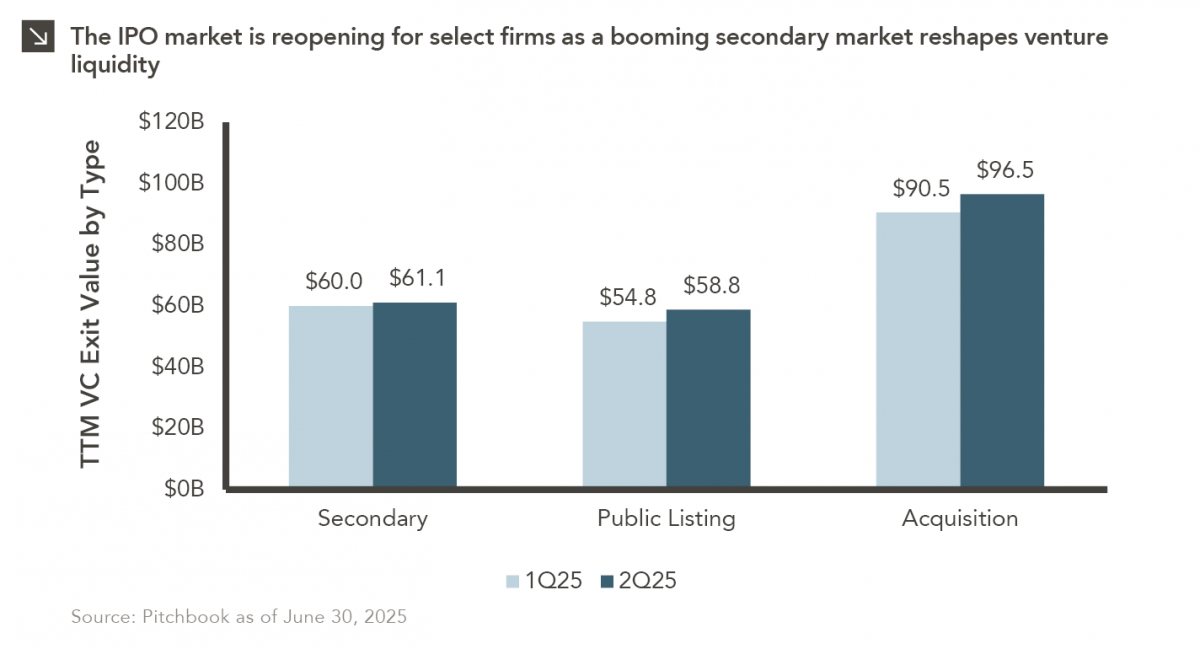
All Eyes on Jackson Hole

Predictions that the Federal Reserve is set to lower interest rates will be put to the test this week as Chair Jerome Powell prepares to outline his view of the economy at the central bank’s annual symposium in Jackson Hole, Wyoming. Most anticipate a more dovish tone from Powell in his remarks on Friday due to weakening labor market dynamics, though recent inflation figures have tempered some of that optimism. While a monetary policy decision will not be made at the Jackson Hole symposium, Powell’s comments are sure to provide insight into what might occur at the Fed’s September meeting, at which there is an 85% chance of a 25 basis point rate cut according to prediction markets. All told, the central bank has three remaining opportunities to make changes to its policy rate in 2025.

Comments from Fed chairs at Jackson Hole have proven significant in the past. For instance, Powell warned that controlling inflation would require economic pain in his speech three years ago, and these remarks sent short-term yields higher. Additionally, at last year’s symposium, he indicated that the Fed was prepared to lower borrowing costs from multi-decade highs, triggering a sharp drop in both the 2- and 10-year Treasury. Yields have retreated across most maturities in recent weeks following a lackluster July jobs report, with the 2-year yield now hovering around 3.75%, meaning a material reaction to Powell’s speech could send short-term yields to multi-year lows.

In the weeks ahead, attention will shift from Jackson Hole to the August jobs report, which could solidify expectations for an interest rate reduction in September. Investors should note, however, that monetary easing would come at a time when inflation remains above target and fiscal stimulus from the Trump administration’s recent spending package looms large. Those dynamics, combined with concerns about political interference at the Fed and recent changes in leadership at the Bureau of Labor Statistics, could lead investors to demand higher compensation for holding longer-dated Treasuries.

3 vs. 2000

In last year’s “2 vs. 2000” Chart of the Week publication, we explored the emergence of trillion-dollar companies, noting that Microsoft and Apple had each exceeded the combined market capitalization of Russell 2000 Index constituents. Since then, another technology giant has crossed that threshold, with NVIDIA recently becoming the first company to reach a market capitalization of $4 trillion. While Microsoft currently hovers around this level thanks to robust earnings and demand for its cloud and enterprise solutions, Apple has experienced more turmoil in recent time. In the first three months of this year, Apple shed nearly $1.5 trillion from its market capitalization amid trade tensions and concerns about slowing growth. During this bout of volatility, the company briefly became smaller than the U.S. small-cap equity universe, but a rally sparked by its announcement to bring manufacturing back to the U.S. helped Apple regain its footing and once again surpass the Russell 2000 Index in terms of market capitalization.

The meteoric rise of Apple, Microsoft, and NVIDIA underscores ongoing investor preferences for large-cap, technology-focused companies. In contrast, the U.S. small-cap space, which is more tilted toward businesses in sectors like Financials and Industrials, has struggled in recent years for this same reason. The Russell 2000 Index has also been negatively impacted by the realization of smaller company growth within private markets, as outlined in a recent newsletter. Going forward, investors should be cognizant of the risks posed by both large and small companies and remain adequately diversified across the market capitalization spectrum.

Reversal of Fortune

The U.S. employment report released last Friday by the Bureau of Labor Statistics (“BLS”) painted a significantly weaker picture of the current labor market. While the domestic economy added roughly 73,000 jobs in July and the unemployment rate ticked up only slightly to 4.2%, the publication included the sharpest downward revisions to previously reported job growth statistics since the COVID-19 pandemic. Specifically, estimates for nonfarm payrolls in May and June were reduced by 260,000. A large share of this downgrade came from state and local government education payrolls, which initially appeared to drive job growth in June but accounted for roughly 40% of recent revisions according to Bloomberg.

Notably, revisions to payroll statistics throughout this year have been consistently downward, with job counts adjusted lower for every month in 2025 to this point. Economists attribute these adjustments to both seasonal recalculations and the growing challenge of lower response rates from surveyed businesses. Indeed, initial response rates to BLS surveys, which sat at around 70% before the pandemic, have slipped below 60% in recent months, which could reflect fatigue or waning trust in institutions on the part of participants. It is also important to note that the government agencies tasked with conducting surveys of businesses and consumers are operating under increasingly tighter budgets, making it more difficult to create an accurate representation of the economic landscape. For instance, the BLS recently disclosed that roughly 15% of the sample used to compile the consumer price index, a key inflation gauge, was suspended from collection due to resource constraints.

President Donald Trump was quick to respond to Friday’s jobs report, dismissing BLS Commissioner Erika McEntarfer and alleging that the publication was manipulated for political reasons. Additionally, Federal Reserve Governor Christopher Waller pointed to labor market data revisions as a key reason for his recent vote to lower interest rates. While the Fed ultimately opted to keep its policy rate unchanged at its July meeting, further deterioration of labor market data may require more expeditious easing from the central bank in the months ahead.

Non-U.S. Stocks: Currency Leads, Earnings Lag

There was a striking reversal in equity performance trends during the first half of 2025, with non-U.S. stocks outperforming their U.S. peers by a significant margin. Specifically, the MSCI ACWI ex-U.S. and Russell 3000 indices returned 17.9% and 5.8%, respectively, on a year-to-date basis through June 30. While it is unclear whether this shift is a temporary phenomenon or the unraveling of a multidecade pattern, a deeper exploration of year-to-date returns for various equity benchmarks may provide some answers. Notably, currency movements, particularly the weakening of the U.S. dollar, have played an outsized role in the returns of non-U.S. stocks this year, adding 14% and 9% to the total year-to-date returns of the MSCI Europe ex-UK and MSCI Japan indices, respectively. Multiple factors have contributed to this bout of dollar weakness, including uncertainty regarding tariffs, concerns about the U.S. fiscal deficit, and a growing global interest in diversifying into non-U.S. assets. European and Asian equities have benefitted from these dynamics, with both regions experiencing strong capital flows in the first half of the year. This helps explain the second-largest return driver for international equities in 2025: multiple expansion. Indeed, improving investor sentiment and capital inflows have recently propelled international equity valuations above their long-term averages. Pledges for increased defense spending and infrastructure development in Europe (as described in a recent Chart of the Week) are especially stoking enthusiasm among investors, with fiscal stimulus measures and rate cuts serving as additional sentiment tailwinds.

While the factors detailed above warrant excitement about non-U.S. equities, it is prudent to address the risks facing the asset class as well. To that point, a third takeaway from the return decomposition detailed above is what is nearly absent from the total return of Europe and Japan: meaningful earnings growth. While certain sectors of the non-U.S. market, such as Financials and Information Technology, have strong growth projections, broad earnings expectations are mixed, with European companies expected to report a 0.3% drop in earnings for the second quarter. In conclusion, there is certainly a case for optimism related to the prospects of non-U.S. stocks going forward, but it is important to underscore the importance of earnings growth as the key driver of long-term returns.

Looking Across the Capital Stack

Despite allocations to various segments of corporate capital structures, most balanced portfolios have a degree of overlap when it comes to sector exposure across equities and fixed income. Still, key differences across the sector exposures of the U.S. equity and corporate bond markets are worth detailing. The extent to which the S&P 500 Index, which serves as a representation of the domestic large-cap stock market, is exposed to the Information Technology space has been described at length, with that sector comprising roughly one-third of the benchmark. This reflects the growth-oriented nature of the equity landscape, which Information Technology and similar sectors (e.g., Communication Services) have dominated due to higher earnings growth and extremely positive sentiment. In contrast, the Bloomberg Investment Grade Corporate Bond Index maintains a 34% weight to the Financials sector, with relatively balanced exposure to spaces like Health Care (11%), Utilities (10%), and Communication Services (7%). This dynamic reflects the capital-intensive nature of these sectors, which are comprised of companies that tend to issue more debt and are considered safer from a credit perspective. Finally, the Bloomberg High Yield Corporate Bond Index is most exposed to the Consumer Discretionary (23%) and Communication Services (15%) spaces, which are more sensitive to economic cycles and, thus, typically offer higher yields to compensate for higher risk.

The varied sector exposures for these indices are reflected in historical return correlation data. On a since-inception basis, the S&P 500 Index has exhibited correlations of 0.40 and 0.63 with the Investment Grade Corporate Bond and High Yield Corporate Bond indices, respectively. These figures suggest that while equities and bonds can move together at times, the asset classes often behave differently. Importantly, these correlations are not static. Rather, they tend to rise during periods of market stress when asset classes often move in tandem due to broad risk-off sentiment. Under normal market conditions, however, the differences in the sector compositions of these indices allow for diversification benefits in a balanced portfolio.

By combining equities with both investment grade and high yield corporate bonds, investors gain exposure to a broader mix of U.S. businesses across sectors and asset classes. This dynamic can help market participants mitigate the impact of sector-specific downturns, making a balanced portfolio more resilient in varying economic environments.

Know Your Volatility

Fiduciaries, trustees, and institutional investors may be understandably puzzled by recent developments and shifts in tone from U.S. regulators and policymakers regarding digital assets. For those not following the space closely, in recent months:

  • The Department of Labor (DOL) rescinded its 2022 “extreme care” guidance and reaffirmed a neutral stance — emphasizing fiduciary process over product exclusion.2
  • Banking regulators softened their posture by withdrawing supervisory guidance, signaling a shift from structural resistance to conditional tolerance and constructive engagement.3,4,5
  • The SEC approved a diversified, multi-asset crypto ETF — marking a pivotal moment in U.S. regulatory acceptance and product offerings.6
  • At the federal legislative level, bipartisan efforts to codify dollar-backed stablecoins suggest the possibility of a broader strategy to reinforce U.S. monetary leadership in both digital finance and capital markets.7,8
  • At the state level, Texas and New Hampshire have enacted legislation to establish digital asset reserve funds or authorize their state treasurers to invest in digital assets.9

These developments may seem at odds with the long-standing perception that digital assets — particularly Bitcoin — are categorically too volatile and immature for institutional portfolios. While the immaturity label is fair and simply a function of time, the volatility story — while true on an absolute basis — loses a bit of its bite when compared to individual stocks.

The chart above illustrates this point using securities from the S&P 500 (blue) and Russell 2000 (light blue) — benchmarks that underpin equity exposures across many investment portfolios. Since 2020, more than 1,000 individual stocks (purple) included in core S&P 500 and Russell 2000 indices have, on average, exhibited annualized volatility comparable to or exceeding that of Bitcoin — including well-known names such as Tesla, Nvidia, Carvana, Hims & Hers, and JPMorgan Chase.¹ While this is not to suggest Bitcoin’s price should be expected to follow the same price movements of a traditional stock, it does start to address the long-held stereotype of its outsized volatility across market cycles. That said, the relative immaturity of Bitcoin (and all digital assets for that matter) should be considered when assessing the relative volatility versus stocks.

Ultimately, the intent here is not to advocate adoption — this is not an endorsement of digital assets. Rather, the goal is to better understand that recent regulatory, policy, and institutional shifts appear to reflect a more empirically grounded understanding of risk.

It is important to underscore that many of these developments remain provisional. Absent more binding legislation, recent guidance and positions could shift under future administrations. Accordingly, Marquette maintains a cautious approach to digital assets. Fiduciary prudence requires a holistic, portfolio-based risk assessment that considers formal legislation and regulatory frameworks, governance standards, plan-specific objectives, and long-term suitability. Fiduciaries require a durable foundation for evaluating potential portfolio inclusion of asset classes. Given the inherent uncertainty of a transient regulatory landscape — and the varied facts and circumstances across retirement plans — a measured, wait-and-see approach seems reasonable.

1 Bloomberg 260-day volatility as of May 30, 2025; 260-day historical volatility for all assets, respectively.
2 U.S. Department of Labor, Employee Benefits Security Administration. Compliance Assistance Release No. 2025-01: 401(k) Plan Investments in “Cryptocurrencies”. May 28, 2025.
3 Board of Governors of the Federal Reserve System. Federal Reserve Board Announces Withdrawal of Guidance for Banks Related to Crypto-Asset and Dollar Token Activities. Press release, April 24, 2025.
4 Federal Deposit Insurance Corporation. FDIC Clarifies Process for Banks to Engage in Crypto-Related Activities. Press release, March 28, 2025.
5 Office of the Comptroller of the Currency. OCC Clarifies Bank Authority to Engage in Crypto-Asset Custody and Execution Services. Interpretive Letter #1184, May 7, 2025.
6 U.S. Securities and Exchange Commission. Order Granting Accelerated Approval of a Proposed Rule Change, as Modified by Amendment No. 1 Thereto, to Amend NYSE Arca Rule 8.500-E (Trust Units) and to List and Trade Shares of the Grayscale Digital Large Cap Fund LLC under Amended NYSE Arca Rule 8.500-E (Trust Units). Release No. 34-103364, July 1, 2025.
7 Reuters. U.S. Senate Passes Stablecoin Bill in Milestone for Crypto Industry. June 17, 2025.
8 Bloomberg Government. Texas Gov. Abbott Signs Bill to Create State Bitcoin Reserve. July 1, 2025.
New Hampshire General Court. House Bill 302: An Act Relative to Enabling the State Treasury to Invest in Precious Metals and DigitalAssets. Signed May 6, 2025. Effective May 7, 2025.

The One Big Beautiful Chart

Late last week, President Trump signed a sweeping tax and spending package, branded by the White House as the “One Big Beautiful Bill,” aimed at enacting major elements of his domestic agenda. Specifically, the legislation cements the substantial tax reductions introduced during the first Trump term, which were slated to sunset at the end of this year. The package also includes an increase to the cap on the state and local tax deduction, raising it from $10,000 to $40,000. Changes to the child tax credit and estate and gift tax exemption were also included in the legislation. A portion of the bill’s funding comes via reductions to programs including Medicaid and the Supplemental Nutrition Assistance Program.

Forecasts from various organizations suggest the immediate effect of these new policies on U.S. GDP growth is indeterminate. For instance, recent reports from the Tax Policy Center and Yale Budget Lab indicate that the domestic economy may see growth increase by less than 1.0% in the years ahead due to the legislation. These estimates are in stark contrast to those of the White House Council of Economic Advisers, which optimistically predicts a 4.8% boon to U.S. GDP by 2028 thanks to the package. Among the provisions contributing to the legislation’s prospects to boost growth are temporary deductions for tip income and higher defense spending. On the cost side, the legislation may increase federal deficits by $3.4 trillion over the next decade and result in millions losing health coverage according to projections by the nonpartisan Congressional Budget Office. These projections have been challenged by both Republican lawmakers and the White House. While the full economic consequences of the “One Big Beautiful Bill” will be revealed over time, the heated debate surrounding the legislation and the size of the package indicate its overall impact could be meaningful in the years ahead.

Bring Out the Big Guns

NATO has decided to take the phrase “don’t bring a knife to a gun fight” quite literally. Last week at the NATO summit in The Hague, the 32 member countries pledged to increase their defense spending as a percentage of GDP from the current 2% target share to a new 5% target share. The pledge includes spending 3.5% on defense items such as troops and weapons and 1.5% on defense-related initiatives such as critical infrastructure, cybersecurity, and resilience measures. This change comes on the heels of criticism from President Trump regarding the underspending of member nations on security, as well as his ambivalent comments on the U.S. commitment to collective defense under Article 5. Additionally, commitments to the alliance have been reinvigorated given the ongoing war in Ukraine and a desire to combat an increasingly hostile Russia.

This new commitment follows a trend of increased defense spending by NATO member states, as there are now significantly more members achieving the 2% target than in previous years. In 2021, the year prior to Russia’s invasion of Ukraine, only six member states achieved the 2% target, compared to 23 member states last year. Some members of NATO even pledged to spend 3.5% of GDP on defense prior to the rollout of the new 5% target. That said, and as this week’s chart indicates, only one NATO country (Poland) currently spends at that 3.5% level.

While the higher spending guidelines are groundbreaking, there is still significant progress that must be made for members to achieve this new level. For example, simply to meet the previously planned target of at least 3.5% of GDP, Germany would have to spend an extra €689 billion on defense through 2035. Similarly, Italy and France would each need to spend more than €400 billion. This increase in spending may provide near-term tailwinds for European equities, particularly defense stocks as detailed in a previous Chart of the Week. However, higher defense spending could add to already ballooning fiscal deficits in many member states, meaning inflation may remain elevated across Europe. While it remains to be seen if NATO members will achieve the new spending target and what the ultimate impact on financial markets will be as a result of these dynamics, one thing is certain: NATO is no longer willing to not be armed and dangerous.

Oil Pares Gains After U.S. Strikes Iran

Last week, Marquette released a publication detailing the importance of the Strait of Hormuz within the context of the global oil trade given recent tensions in the Middle East. Over the weekend, these tensions escalated materially, with the United States carrying out a bombing campaign against multiple nuclear enrichment facilities in Iran. In response, Iranian officials launched a missile attack on a U.S. military installation in Qatar and have threatened to close the Strait of Hormuz, a measure that would need to be ratified by the country’s parliament and national security council. Experts agree that such an undertaking would be highly problematic for the global economy and China in particular, which accounts for roughly 90% of Iran’s oil exports (around 1.6 million barrels per day). Goldman Sachs estimates that a closure of the strait could push the price of oil to more than $100 per barrel.

Interestingly, despite these developments, oil prices have not moved significantly higher in recent time. Brent crude, the international oil benchmark, did climb above $81 per barrel immediately after the U.S. strikes, but has since dropped back to around $72 per barrel as of this writing. Interestingly, most of this decline occurred after the missile attack on the U.S. airbase in Qatar, which may have led investors to believe that oil flows will not be the primary target of the Iranian military going forward. The current figure of $72 per barrel, while still above the five-year average level for Brent crude oil, is largely in line with where the commodity has traded since 2021. Equity markets do not seem particularly phased by this weekend’s strikes either, with major global stock indices finishing Monday in positive territory. These positive dynamics amid a string of negative headlines likely stem from the fact that the Strait of Hormuz has yet to be officially closed, although analysts have reported a slowdown in shipping navigation through the strait since the U.S. strikes. Clearly, much uncertainty remains related to the situation in the Middle East, and asset prices could see increased volatility in the near term depending on the next moves by any of the countries involved.

Oil Markets in Focus Given Middle East Turmoil

Tensions in the Middle East spiked last week following a major escalation in the conflict between Israel and Iran, raising concerns over the stability of the global energy supply chain. To that point, the Strait of Hormuz — a vital chokepoint for global oil and gas flows that connects the Persian Gulf and the Gulf of Oman — has become increasingly fragile amid new reports of electronic interference with navigation systems and a tanker collision near the strait earlier this week. Roughly 20 million barrels of crude oil pass through the Strait of Hormuz each day, accounting for roughly 27% of the world’s maritime oil trade and 20% of total global oil consumption. Additionally, around 20% of global liquefied natural gas (LNG) is transported through the area, primarily from Qatar. Despite the heightened conflict and concerns that Iran could attempt to block the Strait of Hormuz, tanker traffic has remained relatively stable, with 111 vessels reportedly transiting through the Strait on June 15. This figure is down only slightly from 116 on June 12, and consistent with the recent daily range of 100 to 120 vessels.

Most of the material exported through the Strait of Hormuz is delivered to Asia, with roughly 84% of the crude oil and 83% of the LNG being shipped to the region last year. China, India, Japan, and South Korea accounted for approximately 69% of these flows, making Asia particularly vulnerable to supply shocks. While the U.S. has reduced its reliance on Middle East crude oil imports in recent years, with only 6% of its oil imports coming via the Strait, concerns remain for potential inflationary pressures and global GDP headwinds if regional conflicts escalate further.

In response to recent events, Brent crude oil has climbed to over $78 per barrel, and any further escalation could trigger additional volatility in energy prices and, by extension, global financial markets. Indeed, the Strait of Hormuz remains one of the most strategically significant and sensitive corridors for the global economy and investors should continue to monitor developments within the region given the potential for broader economic impacts.