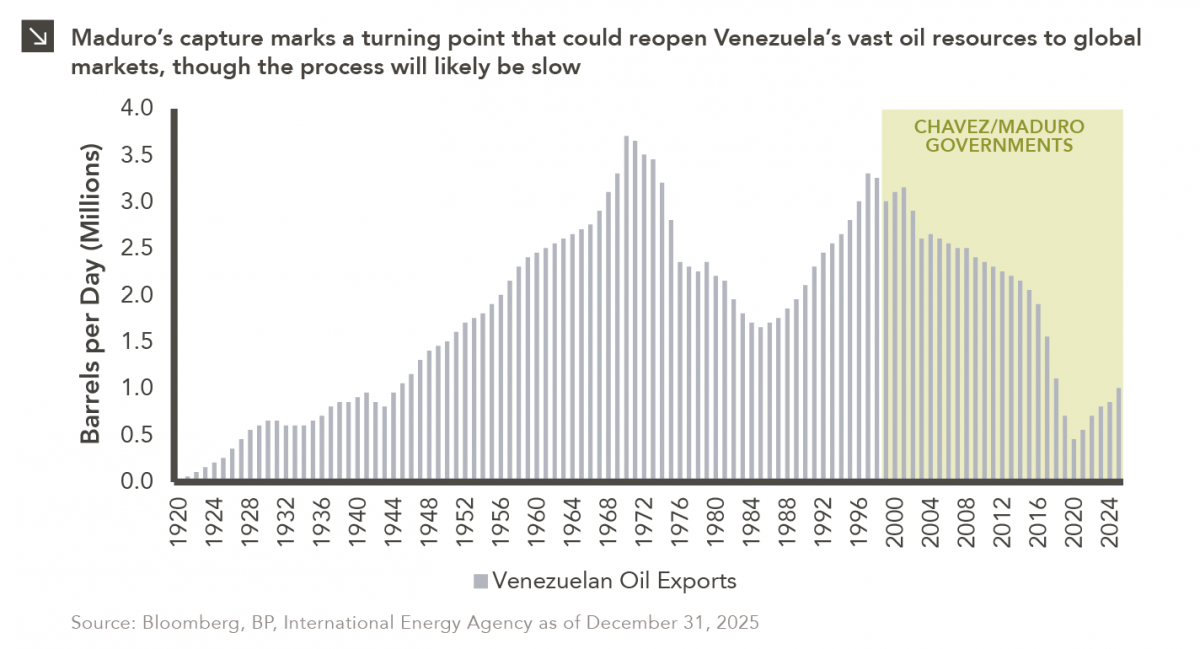
A New Tariff in Town?

During his presidential term, Donald Trump increased tariffs on Chinese imports to address unfair trade practices including intellectual property theft. Specifically, using Section 301 of the Trade Act of 1974, the Trump administration imposed an initial 25% tariff on certain Chinese imports in 2018 that triggered a trade war that persists to this day. After this initial levy, Chinese imports fell by 17% on a year-over-year basis in 2019 and an additional 4% in 2020. That said, imports from China returned to pre-trade war levels in 2021 and 2022. There are a few reasons for this trend. First, in 2019, Trump administration officials feared trade restrictions would ruin the holiday season for American consumers and delayed the enactment of tariffs on certain holiday gift favorites including toys, video game consoles, smartphones, laptops, and computer monitors. Simultaneously, the COVID-19 pandemic shifted consumer preferences away from services and toward goods, resulting in increased demand for Chinese imports despite the tariffs. Additionally, from 2019 to 2022, Chinese imports unaffected by the Section 301 tariffs increased by nearly 50%, offsetting the decline in taxed imports. These factors resulted in an unexpected net increase in overall Chinese imports into the United States over that period.

While certain tariffs have expired, the Biden administration has reinforced several Trump-era trade policies. Earlier this year, for instance, tariffs were increased on goods like steel and aluminum, electric vehicles, battery parts, solar cells, ship-to-shore cranes, syringes, and needles. Given the upcoming U.S. presidential election, it is interesting to note that both major political parties seem to agree that China’s trade practices warrant a continuation of tariffs. To that point, semiconductor tariffs will likely increase from 25% to 50% over the next year. Additionally, in two years, tariffs on lithium-ion non-EV batteries will likely increase from 7.5% to 25%, and those on graphite permanent magnets will likely increase from 0% to 25%. Since the effect of these future tariffs is ultimately unknown, investors should maintain a diversified portfolio to mitigate the fallout from a potential escalation in the current trade war between the U.S. and China.

3Q 2024 Market Insights

This video is a recording of a live webinar held October 23 by Marquette’s research team analyzing the third quarter of 2024 across the economy and various asset classes and themes we’ll be monitoring over the remainder of the year.

Our quarterly Market Insights series examines the primary asset classes we cover for clients including the U.S. economy, fixed income, U.S. and non-U.S. equities, hedge funds, real assets, and private markets, with commentary by our research analysts and directors.

Featuring:
Greg Leonberger, FSA, EA, MAAA, FCA, Director of Research, Managing Partner
Frank Valle, CFA, CAIA, Associate Director of Fixed Income
Catherine Hillier, Senior Research Analyst
David Hernandez, CFA, Director of Traditional Manager Search
Evan Frazier, CFA, CAIA, Senior Research Analyst
Michael Carlton, Research Analyst
Hayley McCollum, Research Analyst

Sign up for research alerts to be invited to future webinars and notified when we publish new videos.

If you have any questions, please send our team an email.

Mexico Winning the Battle with Inflation

Like many countries in recent years, Mexico has grappled with higher-than-average inflation levels, primarily driven by elevated food and producer prices. Mexico notably began tackling its inflation problem earlier than most developed countries in the wake of the COVID-19 pandemic. To that point, Banxico, the central bank of Mexico, started to raise its key rate in June of 2021, roughly 9 months before the U.S. Federal Reserve began its hiking cycle. This key rate reached a peak of more than 11% in early 2023 shortly after Mexican inflation, as measured by headline CPI, achieved a record high of 8.7% on a year-over-year basis. After leaving its key rate unchanged for nearly a year, Banxico finally started to loosen its policy earlier this year given a moderation in both core and headline CPI. Indeed, the most recent reading of core CPI, which came in at a multi-year low of 3.9%, likely allows Mexican policymakers to feel confident that their battle with inflation may be coming to an end. Going forward, lower inflation could portend additional rate cuts by Banxico. This dynamic, in tandem with nearshoring trends that have led to an increase in Mexican manufacturing activity and exports, could be conducive to strong performance for equities in the region.

A Cross Pacific Current

The pullback in global equity indices at the beginning of August left many investors racing to understand what had caused such outsized volatility. Amid this market turbulence, there were two seemingly unrelated economic events that occurred on different sides of the globe. On July 31, the Bank of Japan surprisingly announced that it would raise its benchmark interest rate from 0.10% to 0.25%, continuing its transition from the ultra-low rates that had been commonplace in recent time. Later that week, the July U.S. nonfarm payroll employment data, which many use to gauge the health of the domestic labor market, came in below estimates. This report led investors to question the strength of the U.S. economy and whether the Federal Reserve had waited too long to cut its policy rate. Simply put, equity markets reacted negatively. The Nasdaq, which is a growth-oriented U.S. large-cap stock index, exhibited a particularly sharp drop during this time, falling by roughly 7% in less than one week. The speed and severity of this sell-off left many asking if one poor labor report alone was solely to blame. As it turned out, the Bank of Japan’s interest rate decision earlier in the week may have been just as important as it relates to what had occurred in U.S. markets.

A “carry trade” is a strategy wherein an investor borrows in a low-yielding currency (in this case the Japanese yen) and invests the borrowed funds in a higher-yielding asset. While it is difficult to assess the size and scope of these trades, certain statistical relationships can emerge that may shine light on how borrowed funds are being invested. To that point, the chart above shows the year-to-date changes in level of the Nasdaq index and the value of the U.S. dollar (USD) relative to the Japanese yen (JPY). Interestingly, on a rolling 30-day basis since the start of the year, the movements of the NASDAQ and USD/JPY have been moderately correlated with a coefficient of 0.46 (a coefficient of 1 would indicate a perfectly positively correlated relationship). While indeed moderate, this relationship does indicate that as the dollar has weakened relative to the yen, the Nasdaq has weakened in a similar fashion. What might be driving this relationship?

While we cannot draw definitive conclusions based on correlation alone, the carry trade strategy may be partially responsible for the emergence of this relationship. In the first half of this year, U.S. large-cap stocks notched strong performance while the dollar steadily strengthened against the yen, which kept yen borrowing costs low. That said, when the Bank of Japan raised its policy rate (and the cost of borrowing yen) in late July, many carry trade investors were forced to sell assets to pay back the funds borrowed in yen, which was now rapidly appreciating against the dollar.  For those who had been investing borrowed funds in U.S. stocks, harvesting gains from these positions would be a logical move in order to post collateral. It is important to point out, however, that this process can snowball. Specifically, higher demand for yen drives up the value of the currency, which prompts collateral calls for more investors who have borrowed in yen, which leads to further selling of risk assets like U.S. stocks. This feedback loop can be observed in the shaded region of this week’s chart, during which the correlation coefficient between Nasdaq and USD/JPY jumped to more than 0.9.

While this chart highlights one relationship to provide insight into the recent spike in equity volatility, a broader conclusion readers should draw is that changing dynamics within global markets and the opaque nature of certain trades can make risks faced by investors difficult to identify and measure. As a result, it is important for investors to maintain well-diversified portfolios that can weather various market environments.

Semi-Charmed Country

Index concentration has been top of mind for investors in recent time, as fervor surrounding advances in artificial intelligence has led to outsized weights of a handful of constituents (e.g., Microsoft, Nvidia, etc.) within domestic equity benchmarks like the S&P 500 Index. It is important to note, however, that index concentration is not simply a domestic phenomenon. For example, the Taiwanese equity market is notably exposed to technology-oriented companies, as roughly 80% of the MSCI Taiwan Index is comprised of Information Technology positions. Moreover, the index is heavily tilted toward one company in particular: Taiwan Semiconductor Manufacturing Company (TSMC). TSMC comprises just over 50% of the benchmark and has generated a year-to-date return of roughly 55% through the end of June. As it relates to these dynamics, readers may call to mind two questions: First, how did technology (and semiconductor manufacturing, in particular) come to play such an integral role within the Taiwanese economy? And second, to what extent are global semiconductor supply chains reliant on Taiwan?

TSMC was founded in 1987, with capital provided by the Taiwanese government in hopes of starting a new national industry. At that time, the company decided to focus solely on semiconductor production, which meant creating fabrication plants to manufacture chips for other businesses. This innovative model, commonly known as the foundry model, allowed TSMC to work with semiconductor companies that designed their own chips as opposed to competing against them. It is evident now that this model was hugely successful, as the current revenue share of TSMC accounts for more than 60% of the global semiconductor foundry market. The total market share of Taiwan reaches 70% when one includes other Taiwanese foundry companies (e.g., UMC, PSCM, and VIS). Factors that have led to the country’s strong success in this market include the aforementioned creation of the foundry model, as well as the highly efficient nature of Taiwanese semiconductor companies and the fact that employees in Taiwan’s semiconductor workforce are compensated well relative to those employed in other industries.

Taiwan is clearly the dominant participant in the foundry market, but it is important to note that the production of semiconductors depends on multiple players, including “fabless” chip designers (e.g., NVIDIA), companies that test and package chips, and end manufacturers. This means that the semiconductor supply chain extends well beyond Taiwan, although the country’s role within that chain is clearly crucial, as evidenced by the global chip shortage during the COVID-19 pandemic. In the wake of that shortage, and with continued geopolitical concerns surrounding China and Taiwan, countries around the world have aimed to de-risk supply chains and, therefore, have made significant investments in their domestic semiconductor industries. To that point, many European countries, as well as China, Japan, and the United States, have all committed significant resources to this endeavor. With increasingly complex artificial intelligence requiring more sophisticated chips, the semiconductor space still appears to present compelling investment opportunities, both within Taiwan and throughout the rest of the world.

Keep Your Eye on the Ball

When it comes to baseball, successful hitters have little trouble hitting the ball when they know what pitch is coming. But when pitchers can vary the speed as well as the spin and curve of the ball, hitting becomes exponentially more difficult. An effective curveball can make even the most accomplished hitter look feeble.

As we look at the second half of 2024, we are reminding our clients to “keep their eye on the ball.” Indeed, the first half of the year has been pretty “hittable” as far as returns are concerned, with the majority of asset classes positive through June 30. However, curveballs such as Fed policy, equity index concentration, exchange rates, and a capricious election could quickly flip the script and send investors back to the dugout shaking their heads.

With that said, here is our scouting report for the second half of the year, organized by asset class. We share not only “down the middle” themes but also the curveballs that could flummox performance. A well-prepared investor is no different than a well-prepared baseball player: Insight and realistic expectations provide the foundation for a successful season!

2024 Halftime Market Insights

This video is a recording of a live webinar held July 23 by Marquette’s research team analyzing the first half of 2024 across the economy and various asset classes and themes we’ll be monitoring over the remainder of the year.

Our quarterly Market Insights series examines the primary asset classes we cover for clients including the U.S. economy, fixed income, U.S. and non-U.S. equities, hedge funds, real assets, and private markets, with commentary by our research analysts and directors.

Featuring:
Greg Leonberger, FSA, EA, MAAA, FCA, Director of Research, Managing Partner
Frank Valle, CFA, CAIA, Associate Director of Fixed Income
David Hernandez, CFA, Director of Traditional Manager Search
Evan Frazier, CFA, CAIA, Senior Research Analyst
Hayley McCollum, Research Analyst
Chad Sheaffer, CFA, CAIA, Senior Research Analyst

Sign up for research alerts to be invited to future webinars and notified when we publish new videos.

If you have any questions, please send our team an email.

Divesting From the Enemy

As some readers may recall, members of the Marquette Research Team presented a flash talk on deglobalization at our 2023 Investment Symposium given the proliferation of trends including onshoring and reshoring over the last several years. Another trend that supports the idea of reduced global integration is the drop in foreign direct investment (“FDI”) that has occurred in recent time. Indeed, according to The Economist and IMF, when compared to the six years leading up to the pandemic, average FDI flows dropped by nearly 20% from 2020 through 2022. A variety of factors have contributed to these dynamics, including supply chain disruptions caused by the COVID-19 outbreak, the Russian invasion of Ukraine, and trade tensions between major economic powers.

It may be of particular interest to readers to examine the extent to which capital flows between certain countries have shifted since the start of the pandemic. Perhaps unsurprisingly, the IMF notes that these shifts have been asymmetrical across geographic regions, with Asian countries bearing the brunt of the overall decline in FDI. For instance, both the U.S. and countries in Europe have materially decreased levels of FDI to China since the start of 2020. These dynamics are outlined in this week’s chart.

The Economist notes that geopolitical alignment has served as a major driver of the recent diverting of capital flows and is also a key factor in cross-border bank lending and portfolio flows. To that point, the upcoming presidential contest in the U.S., as well as other high-profile elections across the globe, may be crucial in determining the flow of capital over the coming years, as well as the extent to which deglobalization trends persist. Marquette will continue to closely monitor the impact of geopolitics on the global economic landscape and provide counsel to clients accordingly.

The Emergence of Argentinian Equities

Argentina has faced myriad economic headwinds in recent time, including hyperinflation, currency-related difficulties, and a series of defaults on its sovereign debt. As the country headed into a presidential election year in 2023, Javier Milei, a member of the Argentinian Libertarian Party, emerged as a front-runner in the race, as many viewed his laissez-faire approach to economic policy as having the potential to correct the nation’s trajectory. Milei ultimately won the presidential election and assumed office in December of last year.

Over the last several months, President Milei has enacted a series of unique and controversial economic policies aimed at making the nation’s currency more competitive, reigning in excessive inflation, and stabilizing Argentina’s economic footing. These policies include the devaluation of the Argentinian peso by more than 50% and the introduction of a crawling peg, which is designed to further depreciate the peso. Additional initiatives by the Milei government include lifting capital controls, slashing state subsidies, and scrapping hundreds of government jobs and regulations. This austerity program, while certainly creating its own set of complications for the Argentinian people, has been largely well received by investors. To that point, the MSCI Argentina Index has returned close to 200% on a cumulative basis over the last two years, which is far in excess of the cumulative returns of both the MSCI Emerging Markets and MSCI Frontier Emerging Markets indices in that time. This performance is a sign of investor optimism related to the country’s economic prospects under Milei’s leadership, and Argentina’s status as a world leader in lithium and copper reserves could provide additional support from market participants. Marquette will continue to monitor the progress made by Argentina on the economic front.

1Q 2024 Market Insights Video

This video is a recording of a live webinar held April 25 by Marquette’s research team analyzing the first quarter of 2024 across the economy and various asset classes and themes we’ll be monitoring in the coming months.

 Our quarterly Market Insights series examines the primary asset classes we cover for clients including the U.S. economy, fixed income, U.S. and non-U.S. equities, hedge funds, real assets, and private markets, with commentary by our research analysts and directors.

Featuring:
Greg Leonberger, FSA, EA, MAAA, FCA, Director of Research, Managing Partner
Frank Valle, CFA, CAIA, Senior Research Analyst
Catherine Hillier, Research Analyst
David Hernandez, CFA, Director of Traditional Manager Search
Evan Frazier, CFA, CAIA, Senior Research Analyst
Michael Carlton, Research Analyst
Amy Miller, Senior Research Analyst
Chad Sheaffer, CFA, CAIA, Senior Research Analyst


Sign up for research alerts to be invited to future webinars and notified when we publish new videos. If you have any questions, please send us an email.