C’s Get Degrees (of Pain)

The U.S. distressed debt market is showing increasingly pronounced signs of stress. As of this writing, option-adjusted spreads on CCC-rated U.S. high yield bonds, the riskiest segment of the speculative-grade market, sat above 1,000 basis points, which represents the most extreme level this cohort has exhibited since the March 2023 regional banking crisis. The CCC segment of the high yield market has returned -5.4% since the end of June, compared to -1.1% for the Bloomberg U.S. High Yield Index. It is worth noting that this deterioration extends beyond publicly traded bonds, as the volume of leveraged loans trading at distressed prices (i.e., below 80 cents on the dollar) climbed to approximately $140 billion in October, nearly 90% higher than a year earlier and approaching levels last seen during the COVID-19 pandemic. More severely impaired loans, or those trading below 60 cents on the dollar, totaled approximately $65 billion last month, which represents the highest level since March 2020.

Several factors are likely contributing to these dynamics. First, elevated interest rates are putting pressure on highly leveraged companies, particularly those with floating-rate debt or significant refinancing requirements. These borrowing costs are increasingly difficult to absorb for businesses with limited free cash flow, and a more cautious lending environment has made the refinancing of existing obligations more challenging. Recent market stress could also be a function of adversarial dynamics between borrowers and creditors. Companies with viable refinancing options continue to benefit from strong technical demand for traditional high yield debt and are supported by institutional investors (e.g., insurance companies and pension funds) seeking attractive yields. However, issuers with more limited refinancing options face a much more challenging environment, as creditors increasingly fear borrower-led liability management exercises that could disadvantage certain creditor groups through maturity extensions, selective repayments, or other restructuring tactics. Additionally, investors are increasingly questioning whether technology-oriented businesses can maintain competitive positions and cash flows as artificial intelligence adoption accelerates. Estimates indicate technology companies account for nearly 40% of distressed leveraged loan volume, with software borrowers facing particular scrutiny given the potential for AI-driven disruption and more than $100 billion in upcoming debt maturities. At the same time, the rapid expansion of AI infrastructure has raised concerns about the sustainability of debt-financed capital expenditures. Finally, broader market conditions have added to the pressures within the distressed space, with persistent inflation and a surge in corporate borrowing (including several exceptionally large debt transactions) contributing to greater investor selectivity and wider credit risk premiums.

For investors, the developments detailed above present both a warning about deteriorating credit conditions and a potential source of opportunity. Companies that accumulated substantial leverage when financing was inexpensive may face increasingly difficult choices as debt matures, including refinancing at materially higher rates, asset sales, liability management exercises, or, ultimately, restructuring and bankruptcy. Importantly, the widening in CCC spreads should not necessarily be interpreted as evidence of an imminent broad-based credit crisis, as deterioration remains relatively concentrated among weaker issuers and industries facing structural challenges. To that point, estimates indicate that roughly 20% of the CCC bond index was trading below 60 cents on the dollar in early October, while the remaining, more fundamentally sound portion of the CCC market exhibited considerably more normal spread levels. This distinction is important for investors. While broad exposure to the lowest-rated credit segments carries meaningful downside risk, dispersion across issuers creates opportunities for asset managers with the resources to underwrite individual capital structures, assess recovery prospects, and distinguish temporary headwinds from permanent impairments. For distressed and opportunistic credit strategies, an expanding universe of dislocated securities could create attractive entry points, particularly where market pricing discounts a more severe restructuring outcome than ultimately materializes. However, investors must remain cognizant of potentially lower recovery values, increasingly complex creditor negotiations, and the possibility that current challenges could develop into a more pronounced default cycle.


The Haunting of Emerging Markets

Emerging markets faced a challenging October, with the space declining by around 8.3% amid renewed concerns over the sustainability of AI-related investment and elevated technology valuations. These factors weighed particularly heavily on semiconductor-oriented markets, with the MSCI Korea and Taiwan indices falling by roughly 16.8% and 6.2% during the month, respectively, reversing some of the strong gains notched by these countries earlier in the year. Brazilian stocks have also struggled in recent weeks, with the country’s index falling by approximately 12.0% after an unexpected presidential runoff outcome reversed earlier market optimism and renewed concerns about the country’s fiscal outlook. Indian stocks, which have been laggards within emerging markets on a year-to-date basis, proved relatively resilient with a modest 0.3% gain in October. These dynamics are reflected in the above chart.

This sell-off intensified following disappointing U.S. technology earnings, which raised further questions about whether the substantial capital being invested in artificial intelligence will ultimately translate into adequate shareholder value. Weakness in Google, Amazon, and Intel added to concerns about the scale of investment required to support AI infrastructure and the timing of potential returns. These concerns spilled into Asian semiconductor markets, placing additional pressure on Korea and Taiwan, where technology companies have been major contributors to equity market performance. However, the recent pullback does not necessarily signal a deterioration in the industry’s underlying fundamentals. To that point, Asian semiconductor suppliers continue to report strong demand related to AI, suggesting that the market’s reaction may reflect a reassessment of valuations, capital spending requirements, and expected returns rather than a fundamental weakening in demand. Nevertheless, the heavy concentration of recent market gains in technology-related companies leaves these markets particularly sensitive to changes in investor sentiment.

Brazil faced a separate, country-specific shock in October following the reelection of left-wing incumbent President Luiz Inácio Lula da Silva, who defeated right-wing challenger Flávio Bolsonaro. The result reversed market optimism that had developed following Bolsonaro’s strong first-round performance, when investors anticipated a potential shift toward a more market-oriented administration focused on fiscal consolidation, spending restraint, and pro-business reforms. Instead, Lula’s victory raised concerns that government spending and social programs will remain a priority, complicating efforts to stabilize public finances and reduce Brazil’s substantial debt burden. Brazilian equities fell sharply following the result, while the real weakened and government bond yields rose as investors reassessed the country’s fiscal outlook and unwound positions established ahead of the election. The primary concern for investors is whether Lula’s administration can balance its social spending commitments with the need to contain government debt. Brazil’s public debt already exceeds 80% of GDP, and elevated interest costs leave the government with limited fiscal flexibility. Although Lula has maintained an existing fiscal framework intended to constrain spending growth, investors remain concerned that additional social programs, public investment, and other spending commitments could outpace revenue growth. A sustained deterioration in fiscal credibility could keep borrowing costs elevated, increase pressure on the Brazilian real, and weigh on equity valuations, particularly among domestically oriented companies that are sensitive to interest rates and economic growth.

Finally, India has been comparatively insulated from the semiconductor-led sell-off that impacted other Asian markets given its more limited exposure to the AI-related rally. That said, its relative resilience should be viewed in the context of ongoing challenges, including elevated oil prices and continued foreign investor outflows. Higher oil prices are particularly relevant for India as a major energy importer, potentially pressuring corporate margins, inflation, and the country’s trade balance.

The divergence between these countries illustrates how performance within emerging markets continues to be driven by a combination of global risk sentiment, sector composition, and region-specific developments rather than a single theme. Looking ahead, the sustainability of AI-related investment and the returns generated by that spending will remain important drivers of emerging market performance, particularly for Korea and Taiwan. Continued strength in semiconductor demand could support a recovery if investors regain confidence in the industry’s earnings outlook, although elevated valuations and questions surrounding the profitability of AI investment may contribute to further volatility. Performance of Brazilian stocks will likely remain sensitive to developments surrounding fiscal policy and investor confidence, while the trajectory of oil prices and foreign capital flows should have an outsized impact on Indian equities. Overall, October’s pullback highlights the considerable dispersion beneath the surface of emerging markets and the risks associated with concentrated market leadership. While the strongest markets continue to post substantial gains for the year, the recent sell-off has narrowed their performance advantage and underscored the importance of diversification and distinguishing between markets benefiting from strong structural growth trends and those facing more persistent economic or political headwinds.

Smaller Deals, Larger Appeal

Private equity activity is increasingly shifting toward smaller transactions, with total deal value for transactions of $100 million or less increasing by nearly 60% in the second quarter (on a quarter-over-quarter basis). By comparison, deal value declined by more than 31% and 63% for transactions in the $100 million to $1 billion range and for deals above $1 billion, respectively, over the same period. Deal count fell across all three size categories in the second quarter, but smaller transactions proved more resilient. To that point, total deal count for transactions below $100 million declined by around 7% in the second quarter, compared with declines of 29% for deals between $100 million and $1 billion and 21% for deals above $1 billion.

This shift toward smaller deals comes as private equity firms are experiencing higher entry valuations and a challenging exit environment. Indeed, larger, more scaled businesses are continuing to command premium valuations, in part because fewer sponsors are seeking to exit these assets. This limits the supply of attractive platforms available for sale. Additionally, larger and more mature companies offer fewer opportunities for significant growth or margin improvement, placing greater importance on entry valuations and eventual exit multiples as they relate to realized returns. Conversely, smaller businesses typically trade at more attractive valuations and can offer numerous ways for sponsors to create value, as these companies often have opportunities to grow through acquisitions, operational improvements, professionalization, and expansion into new products or markets. In many cases, private equity firms are also the first institutional investors in these businesses, giving sponsors an opportunity to invest before many of these growth and operational initiatives have been fully implemented.

The valuation gap between these two ends of the market has become increasingly pronounced. As of the end of the first quarter, the median entry multiple for companies valued between $500 million and $1 billion reached more than 13x EV/EBITDA, up from around 12x in 2025. Comparatively, the median multiple for companies valued between $25 million and $100 million declined by roughly 4% over the same period and now sits at just above 8x. Higher interest rates and tighter debt markets have contributed to this divide, making large, highly leveraged buyouts more expensive and increasingly difficult to underwrite.

Investor preferences are also beginning to reflect these dynamics. In addition to the benefits of lower entry valuations and greater potential for operational improvement, limited partners are increasingly favoring sector-specialist managers over generalists and looking further down the market. Lower-middle-market firms can leverage deep industry expertise and established networks to source differentiated opportunities within their target sectors, including proprietary or less intermediated transactions that may be less accessible through broader auction processes. Looking ahead, the lower middle market will likely remain an important area of focus for both sponsors and limited partners. If elevated valuations, higher financing costs, and exit challenges persist, the ability of funds to initiate positions at more attractive valuations and generate returns via company-specific growth and operational improvements will become increasingly important.

Divided We Rise?

Since 1980, the S&P 500 Index has generally performed well in the weeks surrounding U.S. midterm elections. Specifically, the index has notched an average return of approximately 6.5% in the fourth quarter of midterm election years, compared with roughly 3.0% in the fourth quarter of all other years.

Why do stocks tend to perform well following midterm elections?

  • Markets often experience uncertainty ahead of elections, with a recovery sometimes beginning in the days leading up to Election Day. Once the outcome of the election becomes clearer, the range of potential policy outcomes narrows, reducing uncertainty and potentially supporting equity valuations. Historically, this pattern has occurred regardless of which party gains or loses control of Congress.
  • The incumbent president’s party has lost seats in 36 of the last 39 midterm elections. A divided government can limit the likelihood of sweeping policy changes, providing investors with greater visibility into the regulatory and fiscal environment. Major changes to corporate taxes, capital gains treatment, healthcare, financial regulation, and energy policy often require congressional support. Although a divided government can constrain both pro-growth measures and policies that may weigh on corporate profitability, markets may benefit from greater predictability and a narrower range of potential outcomes.
  • Administrations may pursue more difficult or politically contentious measures earlier in a presidential term, while placing greater emphasis on pro-growth policies and economic stimulus as the next presidential election approaches. This dynamic can contribute to a more supportive policy environment for equities later in the presidential cycle.

Does this suggest stocks will rally following next month’s midterm elections?
Historical evidence points to a favorable seasonal tendency for U.S. equities following midterm elections, particularly over the subsequent two to three months. However, this pattern should be viewed as a supportive factor rather than a standalone investment signal. A more compelling outlook would combine favorable election-related seasonality with improving earnings expectations, reasonable valuations, and supportive monetary policy. Of these four factors, at least two currently appear to be in place, providing a potentially constructive backdrop for U.S. equities, although historical patterns do not guarantee positive returns.

The Power Demand Supercycle

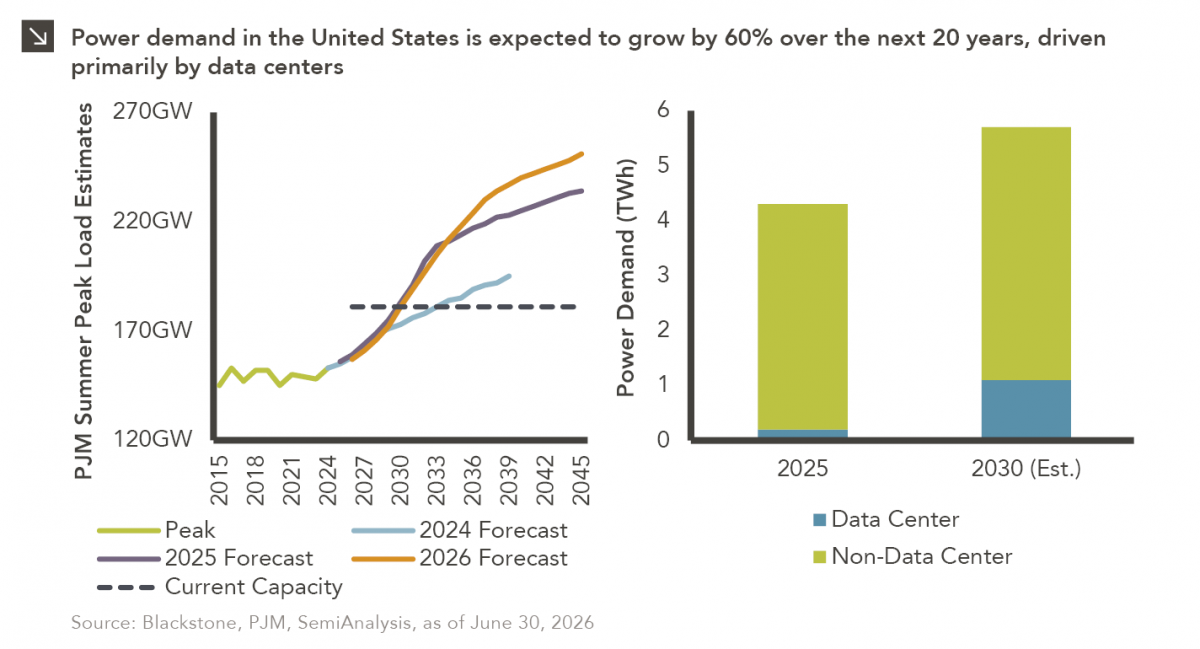
This week’s chart highlights the accelerating growth of electricity demand in the U.S., which has been driven primarily by the rapid expansion of data centers and increasing adoption of artificial intelligence. Specifically, U.S. power consumption is projected to rise from approximately 4.4 TWh in 2025 to 5.7 TWh by 2030, with data centers accounting for a significant portion of this increase. This trend is particularly evident in the PJM electricity market, where peak load is now forecast to reach 251 GW by 2046, significantly exceeding the 181 GW of current capacity. For context, the PJM Interconnection is the regional wholesale electricity market serving all or parts of 13 states and the District of Columbia, while peak load represents the highest level of electricity demand at a given time. The widening gap between projected peak demand and available capacity highlights the need for substantial investment in new generation, transmission, and storage infrastructure to maintain grid reliability and meet growing electricity needs.  Further, successive upward revisions to demand forecasts underscore the magnitude of anticipated electricity needs and the growing pressure on existing power infrastructure.

This widening gap between projected demand and available capacity is creating a substantial investment opportunity across the broader energy infrastructure ecosystem. Beyond data center development, significant capital will be required to expand power generation, modernize transmission and distribution networks, and deploy energy storage solutions to support grid reliability. For infrastructure investors, these trends present opportunities across both traditional and emerging sectors, including regulated utilities, contracted power generation, renewable energy, and battery storage. While the scale of investment needs is significant, execution risks related to permitting, grid interconnection, construction timelines, and regulatory frameworks remain important considerations. Core and core-plus infrastructure strategies may be particularly well positioned to benefit from this structural demand growth through long-duration assets supported by regulated or contracted cash flows.

Spooky Season

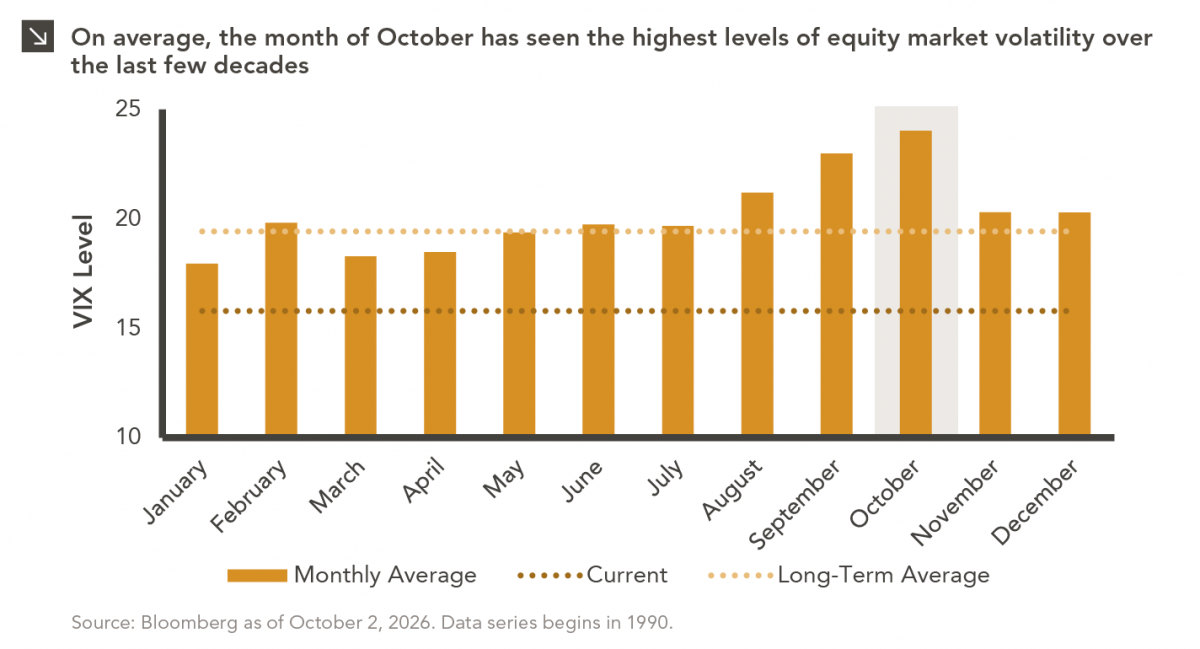
For investors, the spookiest thing about October might not be the ghosts and monsters that are bound to show up at front doors demanding candy, but rather a potential uptick in market volatility, which has remained relatively muted over the last several months. Indeed, the CBOE Volatility Index (“VIX”), which measures expectations for U.S. stock market volatility over the next 30 days based on S&P 500 Index option prices, currently sits at roughly 15.8, placing it close to the lowest third of observations since 1990. Additionally, the VIX has not climbed above 25 since April, suggesting that investors are not currently spooked about the near-term outlook for U.S. equities. It is worth noting, however, that October has historically seen the highest average VIX levels of any month since 1990. These dynamics can be observed in the chart above.

Often referred to as the market’s “fear gauge,” the VIX tends to rise when investors expect greater market uncertainty and fall when expected volatility is lower. A few factors may help explain why the VIX has tended to be higher in October. For instance, U.S. midterm and presidential election cycles can contribute to greater uncertainty during the fall, as investors assess potential changes to fiscal, regulatory, and trade policy that could result from a change in political leadership. To that point, CBOE has observed higher implied volatility around Election Day, including in 2024 as the presidential election approached. It is important to point out that October’s historical volatility has also been heavily influenced by major market events, particularly the Global Financial Crisis. Specifically, the VIX reached an intra-month high of roughly 89.5 on October 24, 2008, as the crisis intensified, and spent most of that month above 60. Additionally, although not captured in the chart above, the infamous “Black Monday” crash of 1987 that saw the S&P 500 Index plummet by more than 20% occurred on October 19. These data points suggest that at least part of October’s spooky reputation is attributable to exogenous market shocks rather than a predictable seasonal effect specific to the month itself.

While October has historically been associated with elevated volatility, market gyrations in the weeks ahead are by no means inevitable. Corporate fundamentals remain relatively strong, providing an important foundation for equity markets even as investors navigate a range of uncertainties. At the same time, the upcoming midterm elections and elevated market valuations could create greater sensitivity to economic developments, potentially contributing to periods of increased volatility. Ultimately, while October may have a reputation for spooking investors, the prospect of heightened volatility should not distract investors from their long-term strategic allocations or lead them to make short-term investment decisions based on seasonal market fears.

Getting Real on Inflation

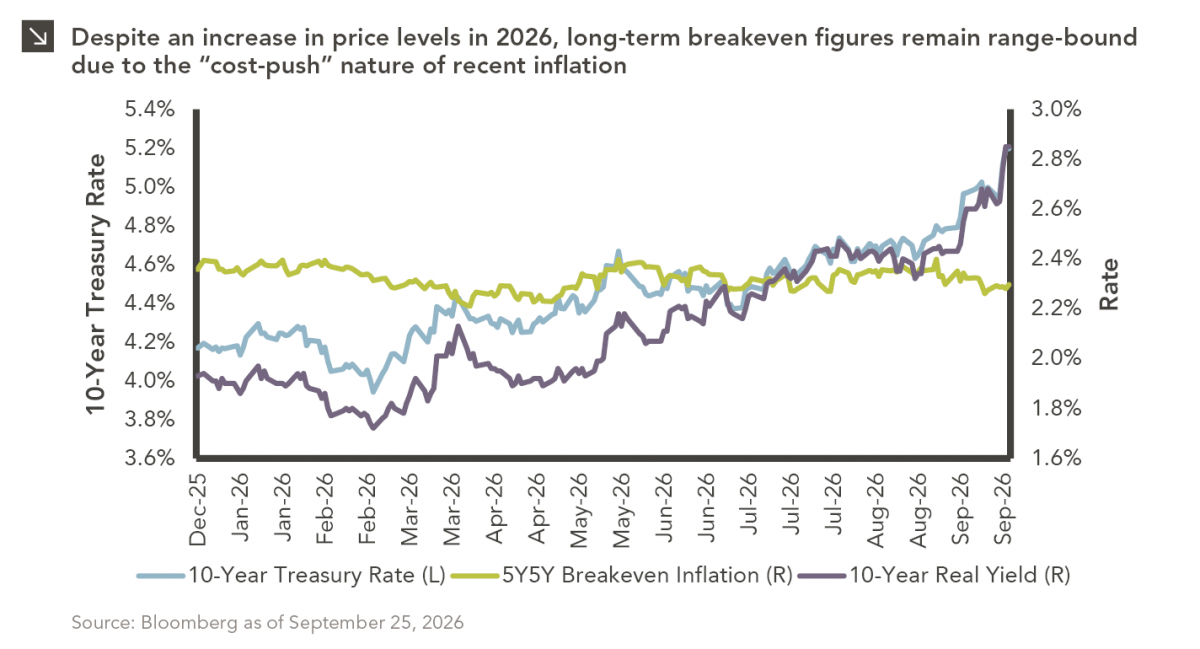
The phrase “expectations of higher inflation” has become a staple in financial news to explain the increase in nominal U.S. Treasury rates this year (e.g., the yield on the 10-year U.S. Treasury security has surged over 80 basis points since the start of 2026). Indeed, the U.S. has seen an uptick in inflation over the last few months, with the Consumer Price Index (CPI) reaching 3.4% on a year-over-year basis in August (up from 2.4% in February but down from an intra-year high of 4.2% in May). Higher energy prices due to the conflict in Iran are a major driver of the increase in CPI, and earlier this month the Federal Reserve hiked its benchmark interest rate for the first time in over three years in response to these price pressures. Given these dynamics, some might reasonably assume that expectations of higher inflation are putting upward pressure on interest rates, but a closer look at the data reveals there may be other factors at play.

This week’s chart shows the nominal 10-year U.S. Treasury rate, the real yield on the 10-year U.S. security, and the “5-Year Forward 5-Year Breakeven Inflation Rate,” which represents expected inflation over the five-year period beginning five years from today. As the chart indicates, the breakeven inflation rate has remained largely range-bound in 2026, meaning nominal interest rates and real interest rates have risen in tandem.

Why has the breakeven rate not increased this year? Traditionally, higher inflation occurs when there is too much money chasing too few goods (i.e., “demand-pull” inflation). Supply disruptions that temporarily increase prices, on the other hand, can lead to what is known as “cost-push” inflation. Notably, disruptions in supply chains during the COVID-19 pandemic caused transitory inflation to become embedded since the money supply also increased dramatically during that period. It is important to point out, however, that despite the closure of the Strait of Hormuz, Federal Reserve policy has remained largely restrictive in 2026 and broader monetary conditions have not loosened significantly. Indeed, commodity shocks often lead to temporary increases in price levels, and this dynamic helps explain why long-term inflation expectations have not increased meaningfully since the beginning of the year.

In effect, rising real yields, rather than higher expected inflation, are driving nominal yields higher. Real yields are driven by economic growth and policy dynamics, and recent movements in real yields are primarily a result of stronger growth forecasts combined with a higher term premium due to concerns around fiscal sustainability and government borrowing. While inflation remains an important consideration for investors, the data suggest that the recent rise in nominal yields is being driven more by changes in the economic and fiscal outlook than by expectations of persistently higher inflation.

Let’s Make a Deal

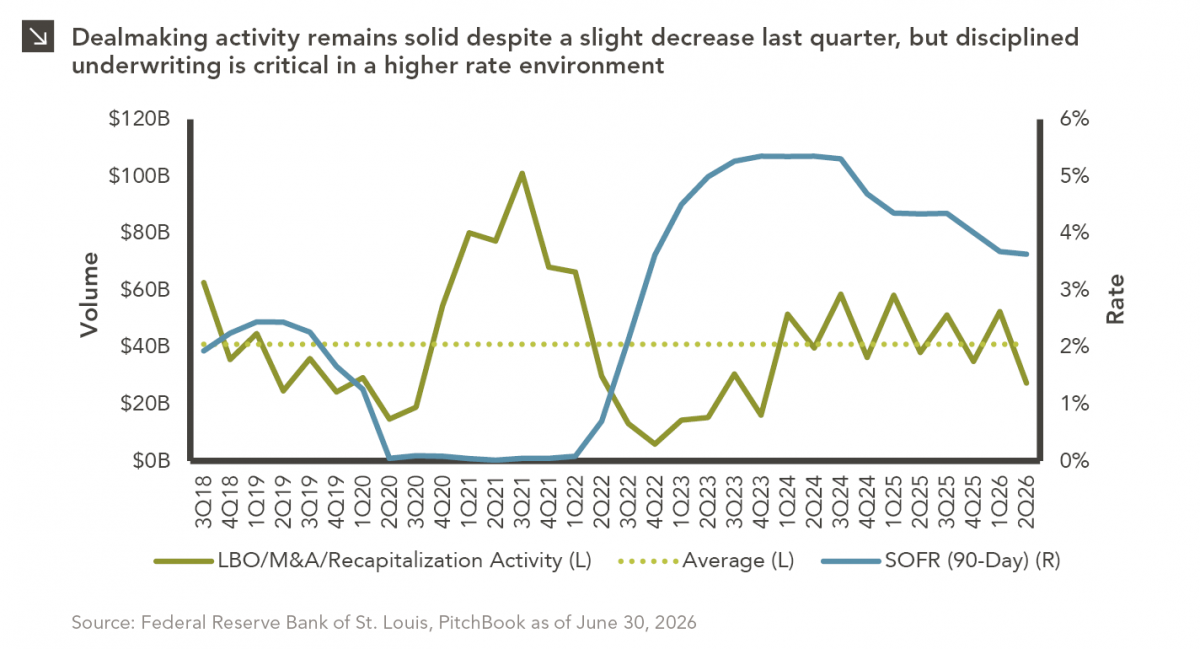
For much of the past several years, the conventional view has been that higher interest rates and stretched valuations would keep buyers and sellers apart within private markets. While elevated base rates did indeed slow transaction activity as the market adjusted to a higher cost of capital, this dynamic did not lead to a structural freeze in dealmaking. To that point, average leveraged buyout, merger, acquisition, and recapitalization volume from the beginning of 2024 through the first half of this year was roughly $44.9 billion, only modestly below the $49.2 billion average exhibited from the third quarter of 2018 through the first quarter of 2022. These data points suggest that buyers and sellers are increasingly finding ways to bridge valuation gaps and transact within a higher cost of capital environment. It is important to note that dealmaking activity declined last quarter due to renewed uncertainty surrounding trade policy, geopolitical risks, and concerns regarding potential disruptions that artificial intelligence may cause within various industries. However, given that deal activity typically varies meaningfully from quarter to quarter, this decline could simply be a function of normal cyclicality rather than evidence of a coming slowdown.

For investors, the current environment presents both opportunities and risks. For instance, elevated base rates continue to support attractive gross yields for direct lenders, while higher debt-service burdens place greater pressure on borrowers and limit the ability of fund managers to financially engineer returns. As a result, underwriting discipline, downside protection, and operational value creation are likely to become increasingly important drivers of investment performance, particularly relative to the low-rate environment during which inexpensive leverage and multiple expansion played a more significant role in generating returns. Going forward, disciplined fund selection will be critical for investors, with manager performance dispersion potentially widening across both the private equity and private credit spaces.

No More Free Lunch?

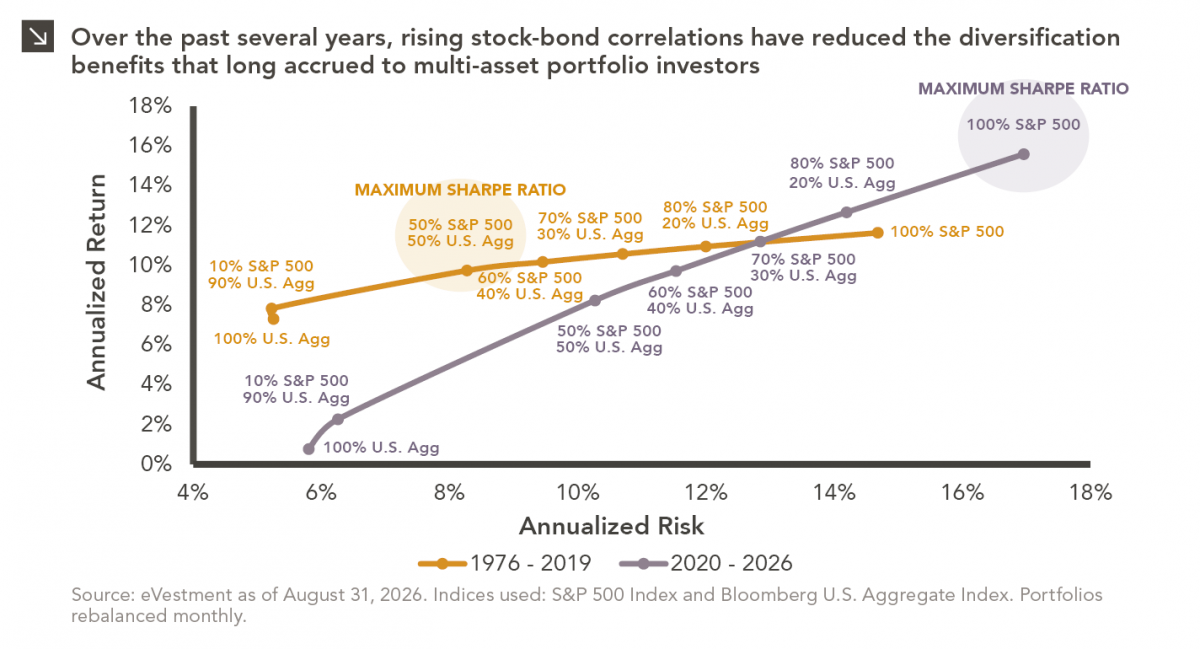
There are many great things about working at Marquette Associates, but “Free Lunch Tuesday” is right at the top of the list for many employees. Each week, the company generously provides catered cuisine from one of Chicago’s many fine dining establishments, and team members gather in the cafeteria to enjoy great conversation, build connections across the firm, and eat a tasty meal free of charge! Of course, since Marquette is ultimately footing the bill, these lunches are technically not “free.” In fact, Nobel Prize-winning economist Harry Markowitz famously stated that “diversification is the only free lunch in investing,” meaning that risk-adjusted returns can be improved simply by combining different assets within a portfolio. For more than four decades, this maxim held true, as an investor could add equity exposure to a fixed income portfolio and increase overall returns while also reducing risk. Specifically, from 1976 through the end of 2019, the Bloomberg U.S. Aggregate Bond Index notched annualized return and standard deviation figures of 7.3% and 5.3%, respectively. Given the lack of correlation between stocks and bonds during that period, however, an investor could have created a portfolio with a 90% allocation to the Bloomberg U.S. Aggregate Bond Index and a 10% allocation to the S&P 500 Index to increase overall returns while decreasing risk. This diversification benefit (i.e., free lunch) can be observed on the left-hand side of the chart above.

Another Nobel laureate, Milton Friedman, famously argued that “there is no such thing as a free lunch,” emphasizing that every benefit comes with an associated opportunity cost. The last several years have certainly supported this notion, as the slope of the efficient frontier of stock-bond portfolio combinations has increased significantly since the start of 2020, and investors across the spectrum of combinations have been required to accept greater risk to achieve higher returns. Remarkably, the 100% S&P 500 Index portfolio exhibited the highest Sharpe ratio (0.69) of any of the combinations on the 2020–2026 efficient frontier, meaning that any amount of fixed income exposure led to lower risk-adjusted returns for investors over this period. This is in stark contrast to the 1976–2019 period, during which the 100% S&P 500 Index had the lowest Sharpe ratio of any possible combination on the efficient frontier (0.51), with the highest being a combination closer to 50% S&P 500 Index and 50% Bloomberg U.S. Aggregate Bond Index (0.65).

The primary driver of the dynamics detailed above has been the breakdown in the traditional relationship between stocks and bonds. Historically, bonds exhibited low or even negative correlation with equities, providing meaningful diversification benefits within multi-asset portfolios. For instance, during periods of economic expansion in previous decades, stronger growth and rising interest rates often weighed on bond prices while supporting corporate earnings and stock valuations. Conversely, during periods of economic stress, declining interest rates generally boosted bond prices while causing equities to come under pressure. Indeed, from 1976 through 2019, the Bloomberg U.S. Aggregate Bond Index exhibited a correlation of 0.20 with the S&P 500 Index. This relationship, however, has changed materially since the start of 2020. That year, the Federal Reserve responded to the economic shock caused by the COVID-19 pandemic with aggressive monetary easing, driving interest rates sharply lower and supporting strong returns across both fixed income and equity markets. The Bloomberg U.S. Aggregate Bond and S&P 500 indices returned 7.5% and 18.4%, respectively, in 2020. In 2022, circumstances shifted sharply, as high inflation, tighter financial conditions, and concerns around corporate profitability proved challenging for most asset classes, and the Bloomberg U.S. Aggregate Bond and S&P 500 indices returned -13.0% and -18.1%, respectively. One notable factor contributing to the higher correlation between stocks and bonds in recent periods has been the increasing concentration of growth-oriented companies within equity indices. Because these businesses derive a significant portion of their value from cash flows expected far in the future, their valuations are particularly sensitive to interest rate fluctuations. As a result, rates have played a more prominent role in determining both fixed income and equity returns over the last few years, increasing the likelihood that the two asset classes move in the same direction. To that point, the correlation between the Bloomberg U.S. Aggregate Bond Index and the S&P 500 Index has been 0.51 since the start of 2020.

While the benefits of a traditional stock-bond portfolio may now be less pronounced than they have been historically, diversification remains a valuable portfolio construction tool because equities and fixed income are still not perfectly correlated. Even if the two asset classes move in the same direction over the coming quarters, the higher bond yields offered today provide a meaningful source of income and return that was largely absent during the low-rate environment of the early 2020s. Additionally, as inflation continues to moderate and monetary policy normalizes, the historical relationship between stocks and bonds is likely to reassert itself, which may restore some of the diversification benefits investors have come to expect from multi-asset portfolios. Although the diversification benefits of a traditional stock-bond portfolio have diminished in recent years, maintaining exposure to multiple sources of return remains a cornerstone of prudent long-term investing. And for all of us at Marquette Associates, let’s hope the phrase “no more free lunch” never extends beyond portfolio theory and into the lunchroom!