Recession Redefined

The National Bureau of Economic Research (NBER) is widely considered the official judge on what is and is not a recession. The academic organization’s traditional definition of a recession is a “significant decline in economic activity that is spread across the economy and lasts more than a few months.” This definition can be subjective and, to help avoid the need for revisions, the committee does not typically call the start of a recession, or the end of a recession, until well after the fact.

Another commonly accepted definition of a recession is at least two consecutive quarters of negative GDP growth. Given the last two GDP prints of -1.6% in the first quarter and the advance estimate of -0.9% in the second quarter, the U.S. economy would be in a technical recession. Recently, both the White House and Federal Reserve Chairman Jerome Powell have argued that this interpretation does not accurately reflect the current state of our economy, specifically given the still-strong labor market.

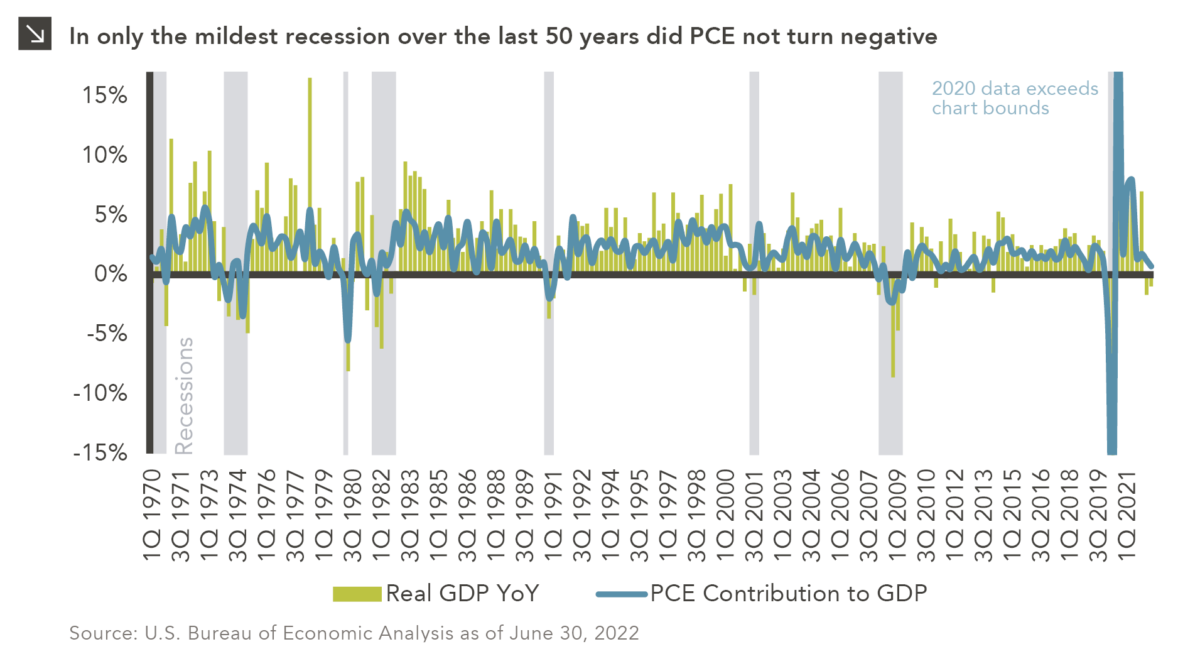
Another economic indicator to consider is consumer spending, specifically the contribution to GDP from Personal Consumption Expenditures (PCE). Consumer spending comprises 70% of GDP and is traditionally a much less volatile component than investment and net exports, the primary contributors to the year-over-year declines in the first half of the year. The strength of the U.S. consumer will dictate the country’s path from here, as healthy balance sheets and a hot labor market contend with decades-high inflation and rising rates. PCE contributed a positive 1.2% and 0.7% to first and second quarter GDP, respectively. In only one of the last eight recessions over the last 50 years — the relatively mild downturn in 2001 — has PCE not turned negative. One month into the third quarter, the highly-regarded Atlanta Fed GDPNow tracker is projecting positive PCE and overall GDP growth for the quarter. The current macro situation is complex, with a healthy U.S. consumer facing a number of headwinds, and, in this case, understanding those underlying dynamics is just as important as the “are we or aren’t we” debate.

Print PDF > Recession Redefined


The opinions expressed herein are those of Marquette Associates, Inc. (“Marquette”), and are subject to change without notice. This material is not financial advice or an offer to purchase or sell any product. Marquette reserves the right to modify its current investment strategies and techniques based on changing market dynamics or client needs.

The Currency Conundrum

The U.S. dollar is the strongest it has been in a generation. The U.S. dollar index is up almost 11% this year against a basket of global reserve currencies with the greenback reaching parity with the euro last week for the first time since 2002. Like many things in financial markets, interest rates tend to be one of the most significant drivers of currency valuation, specifically the interest rate differentials between global central banks. As the Federal Reserve has pivoted to a more hawkish stance to tame decades-high inflation, other central banks, including the ECB and BOJ, have been slower to respond. When capital can flow freely, investors tend to flock to higher-yielding assets as interest rates rise, which leads to appreciation of the higher-interest rate country’s financial account and increases demand for the domestic currency — in this case, the U.S. dollar.

The Japanese yen is down roughly 16% year-to-date and is the worst performing major currency relative to the U.S. dollar. In an effort to fight decades-long deflation, the Bank of Japan has committed to holding down short-term interest rates, resulting in significant currency devaluation. Japan is the largest foreign holder of U.S. Treasuries, with $1.3 trillion as of January 2022. As the U.S. dollar strengthens, it becomes more expensive for Japan to continue to purchase on-the-run Treasury issuances, which could put further upward pressure on U.S. rates at the same time the Fed is lifting the benchmark fed funds rate and engaging in quantitative tightening. The question of what will happen when the two largest buyers of U.S. Treasuries — the Federal Reserve and the Bank of Japan — both remove liquidity from the market is another unknown that could add to market volatility in the near term.

Print PDF > The Currency Conundrum


The opinions expressed herein are those of Marquette Associates, Inc. (“Marquette”), and are subject to change without notice. This material is not financial advice or an offer to purchase or sell any product. Marquette reserves the right to modify its current investment strategies and techniques based on changing market dynamics or client needs.

Halftime Market Outlook: A Mixed Bag

Last week, we hosted our “Halftime” Market Insights Webinar. As the host, my job was to introduce the analyst for each section and then summarize his or her comments before moving to the next speaker. After the fourth section, I found myself using the term “mixed bag” for the third time; it was at that moment that I knew I had my title for this letter!

Of course, “mixed bag” is an overused and unoriginal cliché to describe a perspective that features both positive and negative elements. If we focus solely on the first half of the year, it is hard to find much good news at all between negative economic growth, historically high inflation, and hefty losses in both the equity and bond markets. Even the good news is rooted in how bad things are…after all, how much longer can inflation stay above 9%? Could the equity market REALLY drop another 20% the second half of the year? Alas, our “mixed bag” descriptor admittedly relies on the assumption that conditions should improve at least somewhat for the remainder of the year, though likely not enough to reverse the damage inflicted during the first half. On an absolute and relative basis, growth and return figures should be better, but it is naïve to think that all of the bad news is behind us.

In this edition:

  • Inflation expectations
  • Consumer and business sentiment
  • The S&P 500’s worst six-month start to a year since 1970
  • Recession probability
  • The Agg’s worst start to a year ever
  • Bonds go back to being bonds

Read > Halftime Market Outlook: A Mixed Bag


The opinions expressed herein are those of Marquette Associates, Inc. (“Marquette”), and are subject to change without notice. This material is not financial advice or an offer to purchase or sell any product. Marquette reserves the right to modify its current investment strategies and techniques based on changing market dynamics or client needs.

2022 Halftime Market Insights Video

This video is a recording of a live webinar held July 20th by Marquette’s research team, featuring in-depth analysis of the first half of 2022 and risks and opportunities to monitor in the coming months.

Our Market Insights series examines the primary asset classes we cover for clients including the U.S. economy, fixed income, U.S. and non-U.S. equities, hedge funds, real estate, infrastructure, private equity, and private credit, with presentations by our research analysts and directors.

Sign up for research alerts to be notified when we publish new videos and invited to future webinars.
For more information, questions, or feedback, please send us an email.

Oil Prices Aren’t All They’re Cracked Up to Be

Americans are paying more at the pump this summer than they ever have in the past. The national average in June for regular gasoline was $4.929/gallon. The only other time gasoline averaged more than $4 per gallon nationally was in June and July of 2008 when prices were $4.054 and $4.062, respectively.¹ Crude oil peaked at $140/barrel then. Why are we paying almost $5 per gallon at the pump when crude oil is only about $100/barrel today? The answer lies in the crack spread.

Crude oil is “cracked” to produce gasoline and distillates like heating oil and diesel in a 3:2:1 ratio, meaning for every three barrels of crude, two barrels of gasoline and one barrel of distillates are produced. The crack spread measures the difference between the purchase price of crude and the selling price of the finished products and is a proxy for refinery profits. Crack spreads have spiked over temporary periods in the past, though the median over the last 20 years has averaged just over $11/barrel. The prior peak occurred in August 2005 when Hurricane Katrina took much of the U.S. refining capacity offline, but, like most spikes, was short-lived as refining capabilities were quickly brought back online. The only sustained period of higher crack spreads occurred in 2012 — a year filled with hurricanes, refinery outages, and tensions in the Middle East — when spreads averaged in the mid-$20s throughout the year. At the end of June 2022, the 3:2:1 crack spread hit a new peak of $47.653/barrel, and this bout of elevated spreads may have more staying power.

The green revolution has had some negative externalities. There has been a retreat from refining as companies are reluctant to invest in fixed assets. Throughput has decreased by roughly 500,000 barrels/day to 16.7 million barrels with refineries operating above 90% capacity. Many refiners have closed or converted to producing biodiesel amid fears that refining assets would be stranded during the energy transition. While there is no easy fix to any component of inflation, gasoline dynamics are even more complicated, and until additional resources are committed to refining, higher crack spreads and higher gasoline prices may be here to stay.

Print PDF > Oil Prices Aren’t All They’re Cracked Up to Be

¹Source: U.S. Energy Information Administration


The opinions expressed herein are those of Marquette Associates, Inc. (“Marquette”), and are subject to change without notice. This material is not financial advice or an offer to purchase or sell any product. Marquette reserves the right to modify its current investment strategies and techniques based on changing market dynamics or client needs.

The Business Cycle Diaries

Even the casual observer of market dynamics is likely aware that the world economy appears to be on uneven footing. Elevated price levels, increasingly restrictive monetary policy, and geopolitical turmoil have plagued securities markets during the first half of the year and are now dampening expectations for global GDP growth going forward. Given this myriad of macroeconomic challenges, many investors are now assessing the possibility of a prolonged slowdown in economic activity for both the United States and the rest of the world.

The aim of this newsletter is to gauge the extent to which the global economy is at risk of such a downturn by examining the state of the current domestic business cycle, inferring its likely next stage, and reviewing which asset classes and investing styles tend to be the most attractive during each phase of the cycle.

Read > The Business Cycle Diaries


The opinions expressed herein are those of Marquette Associates, Inc. (“Marquette”), and are subject to change without notice. This material is not financial advice or an offer to purchase or sell any product. Marquette reserves the right to modify its current investment strategies and techniques based on changing market dynamics or client needs.

Active Managers: The Mid-Year Report Card

Domestic equity indices suffered significant pullbacks in the first half of 2022 amid increasing investor concerns of a prolonged economic slowdown. Growth benchmarks were hit hardest given the recent focus on rising rates, although core and value indices across the market capitalization spectrum also notched negative returns during the period. These types of broad-based pullbacks are often conducive to active manager outperformance because, in theory, one of the main benefits of active strategies is protection during down markets. Fund managers are usually able to deliver on this proposition by avoiding speculative stocks with uncertain future cash flows that tend to drop precipitously amid corrections, instead gearing toward high-quality business with pricing power and robust earnings that are able to withstand market swoons. That said, the extent to which managers have been successful in notching returns in excess of their respective benchmarks this year has largely depended on investment style.

In the first six months of 2022, most value-oriented active strategies have done a good job protecting capital. Roughly 67% of managers in the large-cap value space have outperformed their relevant benchmarks, while 90% and 78% have done the same in the mid- and small-cap value spaces, respectively. Core strategies have had similar success. Just over half of large-cap core managers have recorded positive relative returns for the year, while 68% of mid-cap core and 78% of small-cap core managers have outperformed their respective benchmarks. The story is different on the growth side, however, where just 26% of active large-cap, 45% of mid-cap, and 36% of small-cap managers have been able to keep pace with or exceed relevant benchmarks. At a high level, performance of growth indices in 2022 has largely been driven by multiple compression rather than changes in earnings growth or company fundamentals, and active managers are more likely to lag in periods when valuation is the primary driver of market returns.

Marquette recommends allocating between active and passive management based on the efficiency of the underlying market. At the top of the market capitalization spectrum, outperformance has been notoriously difficult in recent history, with roughly two-thirds of all active U.S. large-cap managers trailing the S&P 500 on a trailing 10-year basis regardless of investment style. Mid- and small-cap strategies have had more success generating alpha over longer periods of time given the less efficient nature of those segments of the market, with the majority of managers outperforming their respective indices over the last decade. While even the most capable managers experience periods of underperformance, the case for active management within the U.S. equity space is certainly stronger further down the cap spectrum. Marquette will continue to source best-in-class strategies across all asset classes and recommend these strategies for inclusion in client portfolios where appropriate.

Print PDF > Active Managers: The Mid-Year Report Card


The opinions expressed herein are those of Marquette Associates, Inc. (“Marquette”), and are subject to change without notice. This material is not financial advice or an offer to purchase or sell any product. Marquette reserves the right to modify its current investment strategies and techniques based on changing market dynamics or client needs.

Global Equities Still Well Above COVID Lows

Just over two years ago, on March 23rd, 2020, global equities hit their COVID-19-induced bottom. At their lows, the S&P 500, MSCI Emerging Markets Index, and MSCI EAFE Index were down 30%, 32%, and 33%, respectively, year-to-date. Over the next seven quarters, global equities produced mostly positive returns, with the S&P 500 leading the way. From the 2020 trough, the large-cap U.S. index was up an astounding 119% through the end of 2021.

This year, markets have faced several geopolitical and macroeconomic concerns that have squashed that positive momentum. Russia’s invasion of Ukraine in February and China’s rise in COVID-19 cases combined with its zero-COVID policy have worsened supply chain issues, exacerbated global inflation, and added to mounting economic pressures. To combat inflation, central banks have aggressively raised interest rates, which will likely further dampen economic activity. As a result of these headwinds, the S&P 500, MSCI EM, and MSCI EAFE benchmarks are all down roughly 17–19% year-to-date.¹ Despite these losses, global equities remain well above the COVID-19 trough, with non-U.S. equities still roughly 40+% higher and the S&P 500 77% higher. Looking forward, we expect global equities — particularly in developed countries — to face continued volatility in the second half of the year as central banks continue their fight against inflation, likely at the expense of economic growth.

Print PDF > Global Equities Still Well Above COVID Lows

¹As of June 29, 2022


The opinions expressed herein are those of Marquette Associates, Inc. (“Marquette”), and are subject to change without notice. This material is not financial advice or an offer to purchase or sell any product. Marquette reserves the right to modify its current investment strategies and techniques based on changing market dynamics or client needs.

Can Bond Investors Outsmart the Market?

While it is generally accepted that successfully and consistently timing the equity market is a loser’s bet, the same sentiment is not heard as often in the bond market. However, timing interest rates is just as difficult as equity markets and can lead to the same patterns of underperformance over multiple market cycles. Nonetheless, the recent rate volatility may be a temptation to shorten duration in anticipation of further rate rises. The following analysis examines why this strategy could be difficult to execute successfully, and why we recommend that clients stay the course and remain invested in line with their investment policies.

Read > Can Bond Investors Outsmart the Market?


The opinions expressed herein are those of Marquette Associates, Inc. (“Marquette”), and are subject to change without notice. This material is not financial advice or an offer to purchase or sell any product. Marquette reserves the right to modify its current investment strategies and techniques based on changing market dynamics or client needs.

Private Equity — Living in the 21st Century

In 2011, venture capitalist Marc Andreessen wrote “software is eating the world,” and added that disruptors were “invading and overturning established industry structures.” Private equity firms were taking notes. Over the past decade, technology investments have steadily grown as a percentage of the global buyout market. In 2021, $284 billion in technology deals were closed, accounting for 25% of total buyout deal value and 31% of total buyout deal count — the largest share of any sector. Of that $284 billion, software deals comprised $256 billion. And while capital has flooded the sector, increasing competition for these businesses and driving up multiples, superior performance has continued, both in terms of lower loss rates and higher upside of outperforming deals.

Additionally, the value creation levers being pulled by private equity firms in the technology space appear sustainable. According to DealEdge, in fully realized global buyout deals between 2010 and 2021 with more than $50 million in invested capital, 71% of the value created in technology deals (excluding software) and 55% in software deals was driven by EBITDA growth, relative to 44% for all other sectors. These compelling return characteristics are due in large part to the operating models of these businesses — asset light, scalable, with high margins, and, in most cases, sticky, recurring revenue.

Despite the sector’s broad appeal, technology has proven to be a domain for specialists within the buyout market. The complexity of these business models, constant evolution in the technology landscape, and the need for expertise to lead these businesses at scale lends itself to investors who focus exclusively on the sector. LPs appear to share this sentiment, with more than $270 billion raised by technology-focused private equity firms in the past five years, equivalent to 13% of total global buyout capital raised during that time.

While technology and software stocks in the public arena have suffered over the last year-plus amid rising rates, private companies have not been subject to the same mark-to-market risk. The sector remains a driving force in innovation and economic value creation, and we expect exciting opportunities for private equity firms to persist.

Print PDF > Private Equity – Living in the 21st Century


The opinions expressed herein are those of Marquette Associates, Inc. (“Marquette”), and are subject to change without notice. This material is not financial advice or an offer to purchase or sell any product. Marquette reserves the right to modify its current investment strategies and techniques based on changing market dynamics or client needs.