The Asymmetry of Unemployment

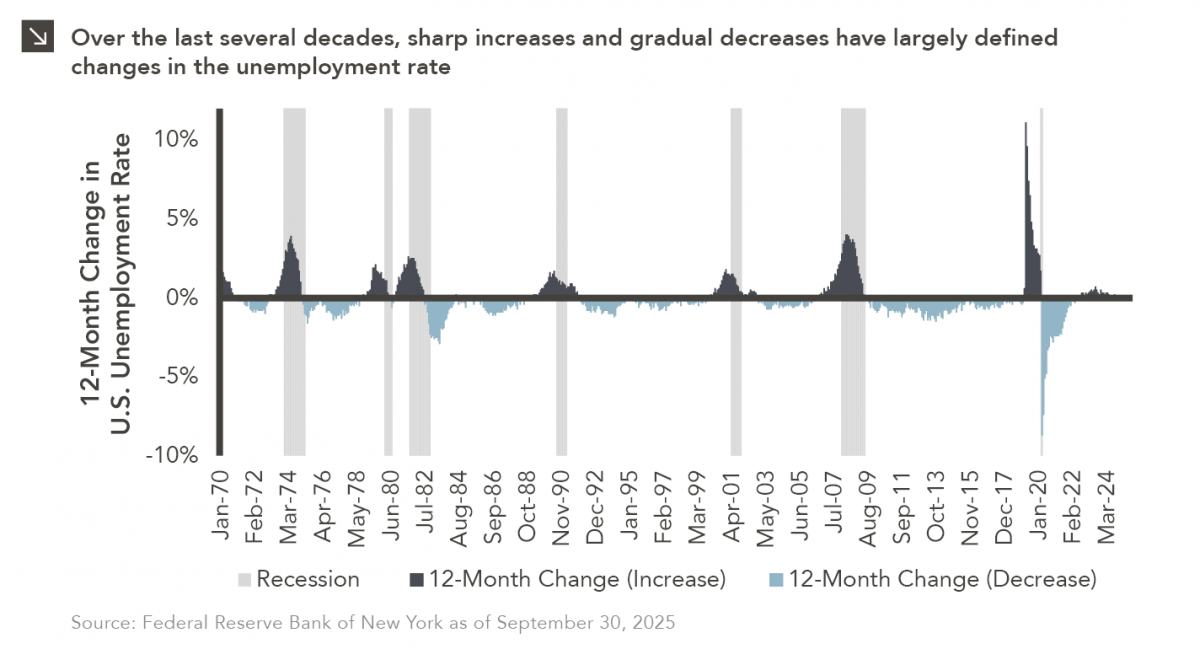
A fundamental characteristic of U.S. labor markets is the pronounced asymmetry in unemployment dynamics, as joblessness rises anywhere from three to five times faster during recessions than it falls during recoveries. This “sawblade” pattern has important implications for economic forecasting, monetary policy, and investment portfolio positioning. Amid recessionary conditions in the early 1980s, unemployment surged from 7.0% to 10.8% in just 16 months (an average increase of more than 0.2% per month). The subsequent recovery took 54 months, with unemployment declining at a rate of less than 0.1% each month on average. The Global Financial Crisis of 2008 exemplifies this pattern even more dramatically, as unemployment jumped from 5.0% to 10.0% in 22 months and normalized over a period of more than six years, during which time millions of workers faced extended joblessness. Most striking was the COVID-19 pandemic of 2020, when unemployment exploded from 3.5% to 14.7% in just two months (the sharpest spike in modern American history). While the initial recovery was faster than historical norms due to unprecedented fiscal and monetary stimulus, the unemployment rate still took 33 months to return to pre-pandemic levels. This illustrates that even with extraordinary policy support, labor market normalization remains gradual. The pattern described above reflects fundamental labor market frictions. On one hand, companies can execute mass layoffs within weeks when facing existential threats or demand shocks. At the same time, hiring is usually carried out with caution, as firms slowly restaff as confidence improves, workers require time to locate appropriate positions, and many require retraining for structural shifts in demand. Indeed, this friction is not a policy bug but rather a feature of how the labor market functions.

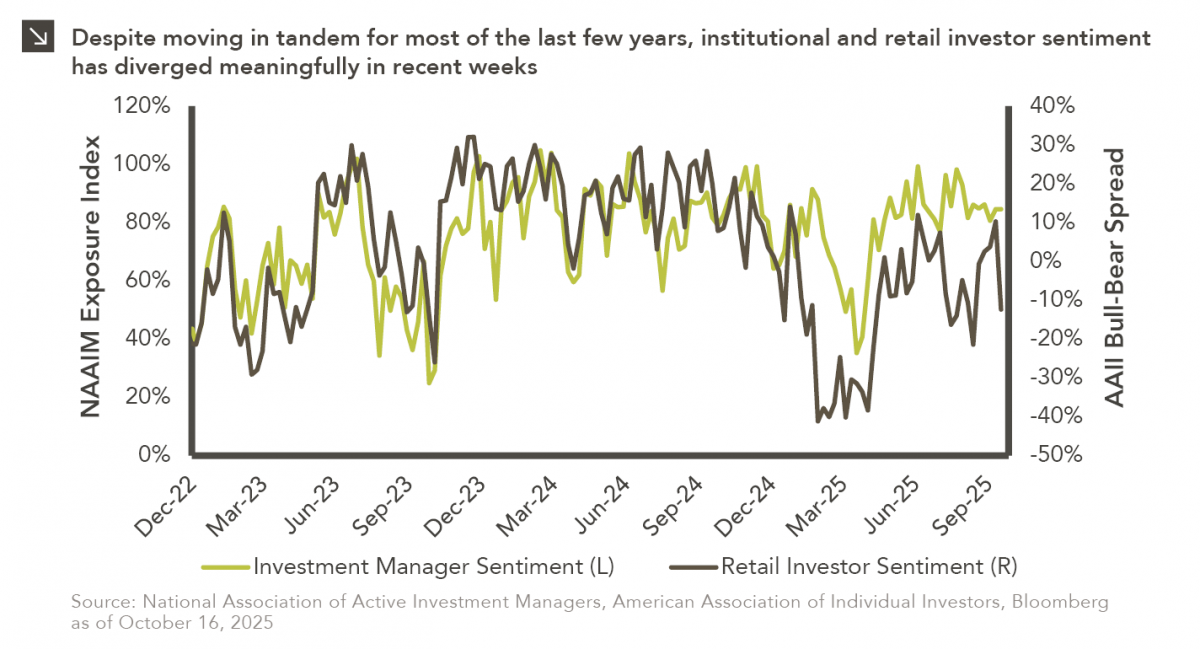
Understanding unemployment asymmetry is critical for investors today as the Federal Reserve navigates an increasingly complex challenge related to its dual mandate of stable prices and maximum employment. Specifically, the Fed faces an unprecedented data vacuum due to the recent government shutdown, and traditional labor market indicators are sending mixed signals. For instance, payroll growth has moderated but remains positive, initial jobless claims are elevated but have not reached recessionary levels, and the unemployment rate has risen yet remains relatively low. Some have also linked the rise of artificial intelligence to recent hiring trends, though it remains unclear whether these trends represent a meaningful secular shift in labor demand. Complications are intensified by inflation that remains stubbornly above the Fed’s 2% target. In short, looser monetary policy could lead to even higher price levels, while restrictive policy could trigger higher unemployment if actual labor market conditions are worse than available data points suggest.

Going forward, the Fed will likely be forced to prioritize one side of its dual mandate over the other, as interest rate policy is too blunt an instrument to fine-tune both price and employment levels simultaneously. The current environment represents precisely the knife-edge scenario in which an understanding of asymmetric labor dynamics becomes essential for economic forecasting.

Don’t Call It a Comeback, Gold’s Been Here for Years

With gold now trading near $4,000 per ounce after a steady multi-year climb, investor attention has turned to the potential role of the commodity in markets and portfolios. Some may view gold’s rise cautiously given shifting perceptions of U.S. policy and debt sustainability, questioning whether the rally reflects a meaningful shift in safe-haven preferences or simply the latest stretch of momentum.

The opinions of most investors have been shaped by an era in which attractive real yields, credible policy, and deep liquidity positioned Treasuries as the world’s premier safe-haven asset. As global reserves and risk frameworks increasingly centered on Treasuries and the dollar, gold’s role as a monetary anchor naturally faded. This week’s chart helps highlight this transition, and the events detailed above underscore how shifts in confidence have shaped market behavior. The Nixon Shock in 1971 ended gold convertibility and closed a monetary era in which trust in the dollar rested on the gold anchor, giving way to one in which confidence hinged on U.S. policy credibility. That credibility was tested early in 1978, when the Dollar Crisis revealed how unsettled the fiat transition remained and required coordinated intervention to steady the currency. By 1981, rate hikes had pushed real yields higher and helped tame inflation, providing the foundation the new system needed. As inflation cooled and credibility strengthened, Treasuries became the stabilizing asset of choice, helping set the conditions for the multi-decade bond bull market that followed (a dynamic that would surface again with the 1994 rate hikes). Decades later, the landscape shifted again with the Global Financial Crisis and quantitative easing by the Federal Reserve. Long-term yields compressed, central bank balance sheets expanded, and the dollar’s share of total reserves began a gradual decline. The pandemic shock in 2020 accelerated these dynamics as debt expanded and real yields turned negative. In recent years, central banks and affiliated institutions have been gradually increasing their gold holdings as a precaution against persistent macroeconomic and geopolitical strains.

Viewed through this lens, gold’s renewed relevance carries a familiar echo. Specifically, the commodity often strengthens when global confidence in the dollar feels tenuous. From this perspective, the recent rally may signal a shift away from a Treasury-centric period rather than any departure from gold’s longstanding function (i.e., a store of value). In that context, conversations regarding the role of gold may broaden from here.

Central Bank Examination

After a largely synchronized hiking cycle beginning in 2022, there has been a slight divergence in interest rate policies across the Federal Reserve, European Central Bank, and Bank of England in recent time. Both the ECB and BoE initiated their easing cycles in the middle of last year, ahead of the Fed, which has since followed suit with its latest rate cut coming last month. The target range for the effective federal funds rate is now 3.75– 4.00%. The policy rate of the BoE also hovers near 4% following its August 2025 cut, and the central bank is expected to maintain this positioning through November. Meanwhile, the latest rate reduction by the ECB in June has brought its policy rate down to roughly 2.2% given the relatively weaker growth and lower inflationary pressures faced by the euro area.

While it is critical for central banks to maintain independent monetary policies tailored to the conditions of their respective economies, disparate rate regimes across the developed world could have significant implications. For instance, global currency markets remain highly sensitive to interest rate differentials, and currency movements can meaningfully shift trade balances since goods from the country with the stronger currency become more expensive abroad. Additionally, investors may redirect capital toward regions with higher yields, impacting security prices and creating volatility in global financial markets as funds move across borders. In conclusion, if these central banks opt for different policy paths going forward, an additional layer of uncertainty will likely be added to the broader economic outlook.

Assessing the Damage

Over the weekend, the Senate overcame a key procedural obstacle in its attempt to end the record-breaking government shutdown, as enough Democrats agreed to advance a bill aimed at resolving the weeks-long stalemate. While previous government shutdowns have only caused short-term economic impacts since furloughed employees eventually receive back pay and federal spending typically rebounds quickly once operations resume, experts warn that the current shutdown has proved more damaging for several reasons. First, the economy is in a more vulnerable position than it was during previous closures, with households already strained by inflation and labor market uncertainty. Additionally, the current impasse has affected not only federal employees but also millions of Americans who are seeing their food assistance disrupted just as the holiday season approaches. As can be seen in this week’s chart, analysts estimate that the shutdown has cost the U.S. economy anywhere from $10 billion to $30 billion per week, with total losses already surpassing those of any previous government closure.

Looking ahead, economists note that while some of the output lost to the shutdown might eventually be recovered once the government reopens, a growing share (particularly in private sector services and tourism) will likely be permanent. The Congressional Budget Office warns that the shutdown could shave as much as two percentage points off fourth-quarter GDP growth, threatening to amplify existing weaknesses in manufacturing and consumer sentiment. Forecasts from major financial institutions have also been revised downward in recent days, with many groups citing rising uncertainty over fiscal policy and declining confidence. As it relates to capital markets, previous government shutdowns have had little impact on equity performance, with the S&P 500 Index averaging a return of roughly 1.5% during closures dating back to the 1980s and generating a positive return in 8 of the last 10 shutdowns. While these figures suggest that investors have largely considered past shutdowns insignificant, economic fallout and weaker sentiment stemming from the current closure could weigh on stocks going forward. For reference, the S&P 500 Index has returned roughly 0.7% since the shutdown began on October 1 through the end of last week, despite four days that saw the benchmark drop by nearly 1% during the period.

No Small Headwind for Small-Cap Managers

Small-cap equities are in a prolonged period of underperformance relative to large-cap stocks, but this trend has shown early signs of reversing in the aftermath of intra-year market lows on April 8, with the Russell 2000 Index up roughly 41% since that time. Interestingly, unprofitable companies within the benchmark have led the way, gaining more than 72% compared to a relatively meager 29% for profitable constituents of the Russell 2000 Index. Although the overall small-cap equity market is currently in line with its average bull market return amid this run, recent performance of unprofitables far exceeds historical norms. This dynamic can be observed in the chart above.

One of the major consequences of this trend is significant underperformance of actively managed small-cap strategies, which typically eschew companies with poor fundamentals. Specifically, the average active small-cap blend manager (as represented by the Morningstar category average) has underperformed the Russell 2000 Index by more than 10 percentage points since April 8, an extreme not seen in roughly 25 years. On the positive side, active small-cap strategies have slightly outperformed profitable small-cap companies, which are more likely to be included in these types of funds. Should this persist, it may be a tailwind for active managers, as profitable companies may have additional upside from here based on trends observed in prior bull markets. That said, more accommodative monetary policy and fiscal support may lead to additional strength from unprofitables and, as a result, further underperformance of active managers.

3Q 2025 Market Insights

This video is a recording of a live webinar held October 22 by Marquette’s research team analyzing the third quarter across the economy and various asset classes as well as themes we’ll be monitoring through the rest of 2025.

Our quarterly Market Insights series examines the primary asset classes we cover for clients including the U.S. economy, fixed income, U.S. and non-U.S. equities, hedge funds, real assets, and private markets, with commentary by our research analysts and directors.

Featuring:
Greg Leonberger, FSA, EA, MAAA, FCA, Partner, Director of Research
Frank Valle, CFA, CAIA, Associate Director of Fixed Income
James Torgerson, Senior Research Analyst
Catherine Hillier, Senior Research Analyst
David Hernandez, CFA, Director of Traditional Manager Search
Evan Frazier, CFA, CAIA, Senior Research Analyst
Dennis Yu, Research Analyst
Amy Miller, Associate Director of Private Equity

Sign up for research alerts to be invited to future webinars and notified when we publish new videos.

If you have any questions, please send our team an email.

The Calm Before the Storm?

I spent the past weekend at my alma mater to watch them play their biggest rival. Football weekends there are filled with celebrations, traditions, and of course, tailgating. Saturday was a quintessential Midwestern day to be outside: sunny, low 70s, light breeze — no better conditions for food and drinks in the parking lot. About three hours before kickoff, however, massive thunderstorms rolled in which sent fans scurrying for cover and threatened to delay the game. For fans who hadn’t checked the forecast, they were ill-prepared to stay dry and enjoy the game as it rained for the duration of the match. Nonetheless, the stadium stayed full for the entire game, a testament to the home team’s performance as well as fan loyalty. That said, I saw plenty of cold and wet attendees in the concourse after the game — those who weren’t equipped for the conditions undoubtedly wished they had been better prepared for what the environment brought Saturday.

On my drive home Sunday, I couldn’t help but worry if as investors we find ourselves right where I was Saturday afternoon, wondering if the conditions were too good to be true for a mid-October day in the Midwest.

Two Sentiments Diverged

This week’s chart compares institutional and retail investor sentiment using two established indicators. Institutional sentiment is represented by the National Association of Active Investment Managers (NAAIM) Exposure Index, which measures the average U.S. equity market exposure reported by NAAIM member firms (i.e., organizations that actively manage client portfolios). Reported exposures for this index include -200% (leveraged short) to -100% (fully short), 0% (market neutral), +100% (fully invested), and +200% (leveraged long), capturing the breadth of positioning from extremely bearish to highly bullish. Retail sentiment is represented by the American Association of Individual Investors (AAII) Sentiment Survey, which reflects the bullish-minus-bearish spread regarding the six-month outlook for stocks across individual AAII members (i.e., retail investors). When analyzed together, these indicators offer perspective on how both institutional and individual investors view the near-term prospects of equity markets.

Readers will note that these two indices have moved in tandem throughout most of the last several years but have diverged significantly in recent weeks as retail investor sentiment has plunged. It is not entirely clear what’s driving this latest divergence, but several factors likely play a role. Specifically, renewed U.S.–China trade tensions, the ongoing federal government shutdown, and interest rate uncertainty have likely weighed more heavily on retail investors, who tend to be more influenced by headline noise. Institutional money managers, on the other hand, appear to be maintaining confidence in healthy corporate fundamentals and the broader economic backdrop. Regardless of its exact cause, this divergence underscores the notion that sentiment data should be viewed as context-dependent rather than as a market timing signal.

2025 Investment Symposium

Watch the flash talks from Marquette’s 2025 Investment Symposium livestream on September 26 in the player below — use the upper-right list icon to access a specific presentation.


Please feel free to reach out to any of the presenters should you have any questions.

The Running of the Bulls

Barring a significant equity market drawdown in the coming weeks, the current bull market will turn three years old in October. The gains posted by the S&P 500 Index during this time have certainly been robust, with the benchmark delivering 24% and 36% returns in the first and second 12-month periods of the current bull market, respectively. This strong performance has led many investors to question if stocks will continue to deliver in the near future. Interestingly, bull markets in decades past have seen positive stock returns well into the third, fourth, and fifth years; however, these gains tend to be more muted than those notched in the first two years. Over the last 50 years, the pattern has often been the following:

  • Year one: Explosive gains are recorded as markets rebound from oversold conditions. The average return of the S&P 500 Index in the year after a bear market trough is roughly 37%.
  • Year two: Equity returns are still strong but less extreme, with the S&P 500 Index averaging a return of 17%. Earnings growth and investor confidence begin to stabilize.
  • Years three–five: Equity momentum slows. Average returns compress to 8%–13% and markets become more vulnerable to corrections.

To expand on the final bullet point, the third, fourth, and fifth years of a bull market often prove shakier given the convergence of several structural factors. For instance, early in the cycle, central banks and governments typically provide aggressive stimulus to allow markets to recover from troughs; however, inflation and financial stability risks typically arise within a few years. These factors usually prompt tightening from policymakers, which can constrain equity performance. At the same time, the sharp rebound in corporate profits that characterizes the first two years begins to normalize, making year-over-year comparisons less favorable. Valuations, which tend to increase in the early innings of a bull market as confidence returns, also usually peak around year three. This causes any future stock gains to be more dependent on genuine fundamental improvements (i.e., earnings growth) rather than continued multiple expansion. Finally, after two years of strong performance, investor sentiment often shifts from optimism to caution, with growing fears that current conditions may not persist. While it is impossible to predict the trajectory of equity markets from here, it may be prudent for investors to expect more muted gains from stocks in the years ahead simply based on historical patterns.