What’s Next for SPACs?

The ferocious appetite for Special Purpose Acquisition Companies (SPACs) continued its momentum throughout the first quarter of 2021. Investors could not get enough of this asset class as a record amount of capital flowed into the space. Through March, 2021 has already seen more SPAC IPOs than all of 2020, with over 300 new deals coming to market. Similarly, gross proceeds thus far through April are already over $100B, well past the $83B that was raised throughout 2020. The space has gotten so hot that sports celebrities like Shaquille O’Neal, Colin Kaepernick, and Alex Rodriguez have all put their names on SPACs that have recently hit the market.

Can this momentum continue? The Securities and Exchange Commission (SEC) might have something to say about it. Earlier this month, the SEC issued new accounting guidance that would classify SPAC warrants as liabilities instead of as equity instruments, as they are currently classified. Warrants are given to capital providers like hedge funds that put up the capital for SPACs before an IPO, to offer the capital provider more upside once the company goes public. SPAC IPOs have since slowed, as affected SPACs would have to restate their financials if this becomes law. With this risk on the table, investors may begin to look elsewhere to put their capital to work, dampening this SPAC market frenzy.

Print PDF > What’s Next for SPACs?


The opinions expressed herein are those of Marquette Associates, Inc. (“Marquette”), and are subject to change without notice. This material is not financial advice or an offer to purchase or sell any product. Marquette reserves the right to modify its current investment strategies and techniques based on changing market dynamics or client needs.

One Year Later, What’s Next?

Welcome to our inaugural quarterly client newsletter! As a way of introduction, I am Greg Leonberger, Director of Research here at Marquette. I have had the privilege of meeting many of you over the years, and for those that I have not worked with previously, please accept this virtual introduction; my hope is to meet many more of you in person once in-person meetings resume. As I embark on this newsletter series, the goal each quarter is relatively simple: provide you with our views on capital markets, the economy, emerging risks as well as opportunities, and hopefully stitch in a few anecdotes to make for a more engaging connection with our readers.

Highlights from this edition:

  • One year anniversary of the equity market trough in 2020
  • COVID-19: lingering uncertainty, vaccine progress, economic recovery
  • Equities update: value and small-cap outperformance, valuations, TINA
  • Fixed income: reflation trade and interest rates, spreads
  • Alternatives: opportunities in real estate, hedge funds, and private markets
  • Inflation worries: money supply and commodity prices

Read > One Year Later, What’s Next?


The opinions expressed herein are those of Marquette Associates, Inc. (“Marquette”), and are subject to change without notice. This material is not financial advice or an offer to purchase or sell any product. Marquette reserves the right to modify its current investment strategies and techniques based on changing market dynamics or client needs.

Q1 2021 Market Insights Video

This video features an in-depth analysis of the first quarter’s performance by Marquette’s research analysts and directors, reviewing general themes from the quarter and risks and opportunities to monitor in the coming months.

Our Market Insights series examines the primary asset classes we cover for clients including the U.S. economy, fixed income, U.S. and non-U.S. equities, hedge funds, real estate, infrastructure, private equity, and private credit, with presentations by our research analysts and directors.

Sign up for research alerts to be notified when we publish new videos here.
For more information, questions, or feedback, please send us an email.

Weak Dollar, Strong EM

For U.S.-based investors, the movement of the dollar has a direct and indirect impact on emerging market equity returns. The direct impact is straightforward. Purchasing foreign-listed equities requires conversion to the local currency. On top of the change in the price and any dividends of the underlying stock, a weakening U.S. dollar creates a positive currency return, while a strengthening U.S. dollar generates a negative currency return.

The movement of the dollar also has an indirect impact on emerging market returns. This week’s chart looks at the performance of the MSCI EM Local Currency Index and the U.S. Dollar Index (DXY). The local currency index removes any direct currency impact, isolating price performance of the underlying stocks. The DXY measures the U.S. dollar versus a basket of trade partner currencies. Since 2000, the correlation of monthly returns between the local currency index and the dollar index is -0.40, meaning historically they have moved in opposite directions.

There are several reasons why a weak dollar is supportive of emerging market equities. A weaker U.S. dollar is generally positive for overall economic growth and emerging economies typically benefit from strong global growth. Many developing economies are also reliant on dollar-issued debt. A weaker dollar lowers the cost of borrowing, a positive for emerging markets companies and equity markets. The U.S. dollar weakened throughout most of 2020, with the DXY down 10% between February and December. Over that same time frame, emerging markets equities returned 19%. So far in 2021, the dollar is up modestly, with emerging markets pulling back more recently. Looking forward, we expect the historical relationship between the two to persist, positioning emerging market equity investors to benefit should the dollar weaken further.

Print PDF > Weak Dollar, Strong EM


The opinions expressed herein are those of Marquette Associates, Inc. (“Marquette”), and are subject to change without notice. This material is not financial advice or an offer to purchase or sell any product. Marquette reserves the right to modify its current investment strategies and techniques based on changing market dynamics or client needs.

Signs of a Market Bottom: One Year Later

This month marked the somber one-year anniversary of the World Health Organization declaring COVID-19 a global pandemic. In addition to the immeasurable human suffering the disease has caused, the toll on both the financial markets and broader economy has also proven historic in magnitude. After the unprecedented market volatility in March 2020, two questions on many investors’ minds were if a market bottom had been reached and if a recession was underway. The S&P 500 hit an all-time high on February 19th, 2020, and subsequently experienced a fast and furious COVID-induced sell-off resulting in its March 23rd bear market trough. Although at that time, investors could not be certain this was the bottom as economic uncertainty remained high while the pandemic was still in its early stages. To help reason through the two questions noted above, we wrote “Signs of a Market Bottom?” which analyzed four broad categories in an attempt to identify markers of a trough: Technical Data, Valuation Data, Economic Indicators, and COVID-19 Data. This information was examined in the context of bear markets that coincided with recessions, which is an important distinction because one can exist without the other. Our analysis indicated that all but valuation data were useful in identifying a market trough.

Given that it has been over a year since the rapid peak–trough-bull market start, the purpose of this paper is to revisit the four aforementioned categories to see which, in hindsight, were relevant in identifying the 2020 market bottom.

Read > Signs of a Market Bottom: One Year Later


The opinions expressed herein are those of Marquette Associates, Inc. (“Marquette”), and are subject to change without notice. This material is not financial advice or an offer to purchase or sell any product. Marquette reserves the right to modify its current investment strategies and techniques based on changing market dynamics or client needs.
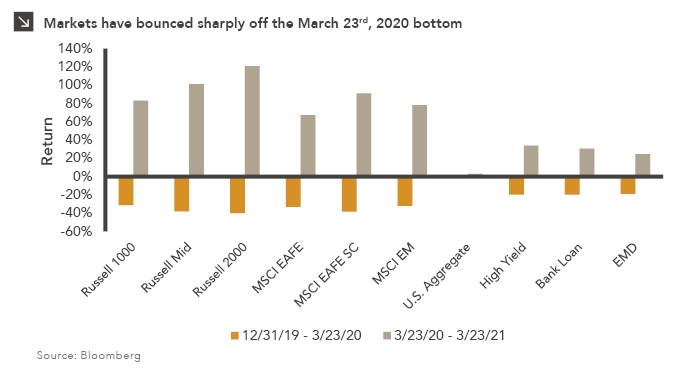
One Year Ago, Would Anyone Have Predicted This?

What a year it has been. Officially one year after the equity market’s bottom on March 23rd, 2020, all major indices in the chart above have at least recovered back to ending 2019 levels. The groups that were hit the hardest have also rebounded the strongest, with returns over the last year exceeding 100% for some. Small-cap equities stand out, especially in the U.S. — up 121% over the last year and up 33% over the almost 15-month period since 2019. U.S. mid-cap equities are up 101% over the last year, up 25% over the full period, and U.S. large-cap equities are up 83% over the last year for a 26% return over the full period. Small-cap stocks have also outperformed internationally — the MSCI EAFE Small Cap Index is up 91% over the last year and 18% since 2019, while the MSCI EAFE Index is up 67% over the last year and 12% for the full period. Emerging markets, some of the hardest hit by the crisis last year, have more than recovered, up 78% over the last year for a 22% return since 2019. Fixed income returns have been more muted. Investment grade bonds stayed positive in early 2020 as equity markets fell precipitously and are up another 3% since. High yield bonds, bank loans, and emerging market debt were hit harder but still held up better than equities. Each group has recovered those losses but remains in positive single-digit territory over the full period.

From here, we expect returns will likely moderate. As the vaccine roll-out continues we expect further economic re-openings and renewed growth across the globe, but it seems highly unlikely capital markets returns can continue at this pace beyond the initial recovery.

Print PDF > One Year Ago, Would Anyone Have Predicted This?


The opinions expressed herein are those of Marquette Associates, Inc. (“Marquette”), and are subject to change without notice. This material is not financial advice or an offer to purchase or sell any product. Marquette reserves the right to modify its current investment strategies and techniques based on changing market dynamics or client needs.

Driving Toward a Green Future

Innovation and structural change were hallmarks of 2020 as the spread of COVID-19 accelerated technological advancements across many areas of the global economy. The electric vehicle (“EV”) space is one area of innovation that has especially captured the attention of global investors. While battery-powered and alternative energy vehicles have been available in some form since the early 19th century, it was not until significant developments in rechargeable lithium-ion battery technology were made in the 1970s that meaningful capital began to flow to the space. Since then, interest in EV technology has ebbed and flowed with oil prices, but the recent global push toward green energy has revitalized enthusiasm in the space.

For the three years ended 2019, the NYSE FactSet Global Autonomous Driving and Electric Vehicle Index, which tracks developed and emerging market companies that specialize in self-driving and EV innovation, underperformed the broader MSCI ACWI Index — up an annualized 8.8% versus the ACWI up 10.2%. Since then, over the 14 months from the start of 2020 through February 2021, the Global Autonomous Driving and Electric Vehicle Index is up 63.1% versus the MSCI ACWI Index up 16.3%.

To dive deeper into the different components of the electric vehicle landscape, we look at the newly-created Bloomberg Intelligence Electric Vehicle Basket, a group of 60 global companies expected to benefit from and contribute to the success of EV development. These 60 companies, equal-weighted, have outperformed the MSCI ACWI by 10.3% over the trailing three months ended February 28th. Of the four unique sub-groups,¹ Raw Materials has outperformed by the widest margin, returning 46.3% since December. This cohort includes a diverse group of specialty chemical and mining companies that produce the inputs for a variety of industries, many of which, including those tangential to EVs, have seen increased demand over the last few months. The Battery and EV Component groups have also outperformed the broader MSCI ACWI Index. EV Vehicle Manufacturer stocks have struggled more recently amid profitability concerns given the cost of inputs and headwinds to EV adoption, particularly in the U.S. Despite the push from lawmakers, still limited charging infrastructure and a lack of consistency in charging connectors across manufacturers are issues for consumers. While we expect these and other points of friction will be resolved and EV market share will continue to grow over the next several decades, in the near term, market momentum can push innovation themes ahead of expected earnings or scalability. Investors should exercise caution when allocating to a burgeoning segment of the market and always maintain portfolio diversification.

Print PDF > Driving Toward a Green Future

¹A fifth Bloomberg exposure, EV Charging, included only one company and was included in the EV Components categorization for this analysis.


The opinions expressed herein are those of Marquette Associates, Inc. (“Marquette”), and are subject to change without notice. This material is not financial advice or an offer to purchase or sell any product. Marquette reserves the right to modify its current investment strategies and techniques based on changing market dynamics or client needs.

Sustainable Investing Among Equity Asset Classes

Sustainable investing continues to grow in both size and relevance among institutional investors and asset managers. As a matter of background, sustainable investing is a term that encompasses three broad approaches: ESG Integration, Socially Responsible Investing, and Impact Investing. As elaborated on in Marquette’s Sustainable Investing video series, the definitions of each of these terms are:

  • ESG Integration: Returns-focused investing that incorporates long-term sustainability factors (Environmental, Social, Governance) into the investment process.
  • Socially Responsible Investing (SRI): Investments driven first by ethical values.
  • Impact Investing: Investments with the specific intent to create and measure social and/or environmental impacts alongside financial returns.

While SRI and Impact Investing are more targeted strategies driven by underlying initiatives and/or beliefs, ESG integration has allowed portfolio management teams of more traditional approaches to consider social and environmental issues in a more tangible way than in the past. As ESG factors are more ingrained in the investment processes, there will be more investment options that contribute, directly or indirectly, to some of the ideals sought after in SRI and Impact portfolios. As shown in the above chart, investors have options across the global equity universe for both ESG integrated funds as well as dedicated SRI/Impact Investing funds. The proportions of each are likely to expand as sustainability investing trends accelerate globally.

Along with this growth comes an increased emphasis on measurable impact and standardized reporting, both of which have been a challenge in the sustainable investing space. We have started to see investment managers adopt the United Nations Sustainable Development Goals (UN SDGs) as a framework for expressing the sustainable intent or reach of their portfolio. For instance, there is a growing contingent of investment managers that have mapped their portfolio holdings to one or more SDGs based on whether the firm’s product or service aided or harmed the stated end goal. We have also seen many investment managers become signatories of the UN Principles for Responsible Investment (PRI) over the last three years. The UN PRI are comprised of six foundational principles that work to support and encourage ESG investing. Another sustainable investing reporting metric that has become more readily available is carbon intensity measures. While there have been many positive developments in recent years, investors should be cognizant of potential greenwashing — disingenuous or misleading attempts to present strategies as more ESG-focused than they actually are.

Overall, sustainable investing is moving in the right direction as more allocators and investment managers realize that returns need not be sacrificed in pursuit of positive change. In fact, a fundamental concept of sustainable investing is that firms with better ESG practices tend to fare better over the long run due to a reduced likelihood of litigation, increased diversity, and capitalization on emerging sustainable technologies, among others. Marquette continues to monitor these developments and stands ready to assist clients in pursuing their sustainable investing goals.

Print PDF > Sustainable Investing Among Equity Asset Classes

eVestment Universes
U.S. Large-Cap: “US Large Cap Equity” 1,129 Products
U.S. Mid-Cap: “US Mid Cap Equity” 289 Products
U.S. Small-Cap: “US Small Cap Equity” 640 Products
International Large-Cap: “EAFE Large Cap Equity” 219 Products & “ACWI ex-US Large Cap Equity” 142 Products
International Small Cap: “EAFE Small Cap Equity” 101 Products & “ACWI ex-US Small Cap Equity” 67 Products
Emerging Markets: “All Emerging Markets Equity” 654 Products


The opinions expressed herein are those of Marquette Associates, Inc. (“Marquette”), and are subject to change without notice. This material is not financial advice or an offer to purchase or sell any product. Marquette reserves the right to modify its current investment strategies and techniques based on changing market dynamics or client needs.

Fear is the Return-Killer

Frank Herbert’s science fiction novel Dune contains a litany which states that “fear is the mind-killer.” Indeed, anxieties brought on by periods of turmoil can cause individuals to forsake rational thinking and act impulsively, usually to their own detriment. This phenomenon often manifests itself in equity markets, particularly when investors choose to curtail or altogether abandon equity allocations amid (or in expectation of) steep declines in the prices of risky assets. These impetuous actions stem from various emotional biases held by market participants including loss-aversion, which describes the asymmetrical response many individuals feel with respect to gains and losses (i.e., investors derive more pain from a loss than pleasure from a gain of equal value).

The aim of this newsletter is to demonstrate that, save for a modicum of intangible psychological comfort, sales of risky assets motivated by fear and panic provide investors no value, and can ultimately have disastrous impacts on the long-term returns of a portfolio.

Read > Fear is the Return-Killer


The opinions expressed herein are those of Marquette Associates, Inc. (“Marquette”), and are subject to change without notice. This material is not financial advice or an offer to purchase or sell any product. Marquette reserves the right to modify its current investment strategies and techniques based on changing market dynamics or client needs.

Small-Cap: Much Ado About Quality

2020 was a year in which some small-cap asset managers flourished while most struggled to adapt to the changing tides of an unprecedented global pandemic. Active managers will not soon forget the difficulty of investing in 2020, but the dynamics that predicated the market may go overlooked.

In this newsletter, we seek to address the underperformance of small-cap active managers over the last several years, focusing on factor fallout and the definition of quality. We will specifically look to address how the rise of thematic versus fundamental investing came to the forefront in 2020.

Read > Small-Cap: Much Ado About Quality


The opinions expressed herein are those of Marquette Associates, Inc. (“Marquette”), and are subject to change without notice. This material is not financial advice or an offer to purchase or sell any product. Marquette reserves the right to modify its current investment strategies and techniques based on changing market dynamics or client needs.